

We’re hiring a UI / UX designer with experience in data visualization
June 28th, 2024
6 min
This article is brought to you by Datawrapper, a data visualization tool for creating charts, maps, and tables. Learn more.

At Datawrapper, we’re always looking for new ways to help you create better data visualizations. You’ve probably already read design opinions on our blog, followed tutorials in the Academy, or gotten troubleshooting help in our support inbox — but up to now, we haven’t often met “face to face.” That’s about to change as Guillermina Sutter Schneider becomes our first product specialist and evangelist. She’ll be here five days a week giving workshops, webinars, talks, and more as part of the customer support and success team.
We asked Guillermina a few questions to get to know her better.
Sure! Hi everyone, I’m Guillermina. I was born in Rosario, Argentina (think: Messi). Before moving to Berlin in August 2022, I lived in Washington, D.C. for seven years. In 2021 I took a break from the big capital and lived in Curaçao (a tiny Dutch island in the Caribbean) for six months. I love traveling and learning new languages!

I consider myself a curious person; I like to teach myself new skills through online courses and YouTube. That’s how I learned d3.js, p5.js, Processing, Adobe Illustrator, and InDesign. In my free time I also enjoy reading about color theory (my favorite book is “Interaction of Color” by Josef Albers, which I recommend 100%) and typography.
I studied economics in Argentina and in 2015 I moved to Washington, D.C. to work as an economic researcher at a non-profit organization. My research was mainly focused on international development issues. My team and I tried to find answers to questions like: Why do countries grow economically? What policies did countries X and Y implement to reduce their poverty rates? What does the state of women’s freedoms look like in X and Y regions of the world?
In 2020, I graduated with a master’s degree in data science and that opened lots of doors for me: coding, math, statistics, machine learning models, neural networks, etc. It gave me the tools to scrape, clean, organize, and analyze big data, and automate many processes that up until that moment I was doing manually.
The Data Visualization Guidelines I coauthored for the Cato Institute in 2018 was the very first data vis project I worked on (and my favorite one so far!). I remember this project to be a turning point in my professional career: It was around this time that I realized I wanted to become a data visualization specialist.
Lately, I’ve become more and more interested in generating abstract art with underlying data. I would like to see if I can replicate some of the work I have already done or come up with new pieces of data art with Datawrapper.
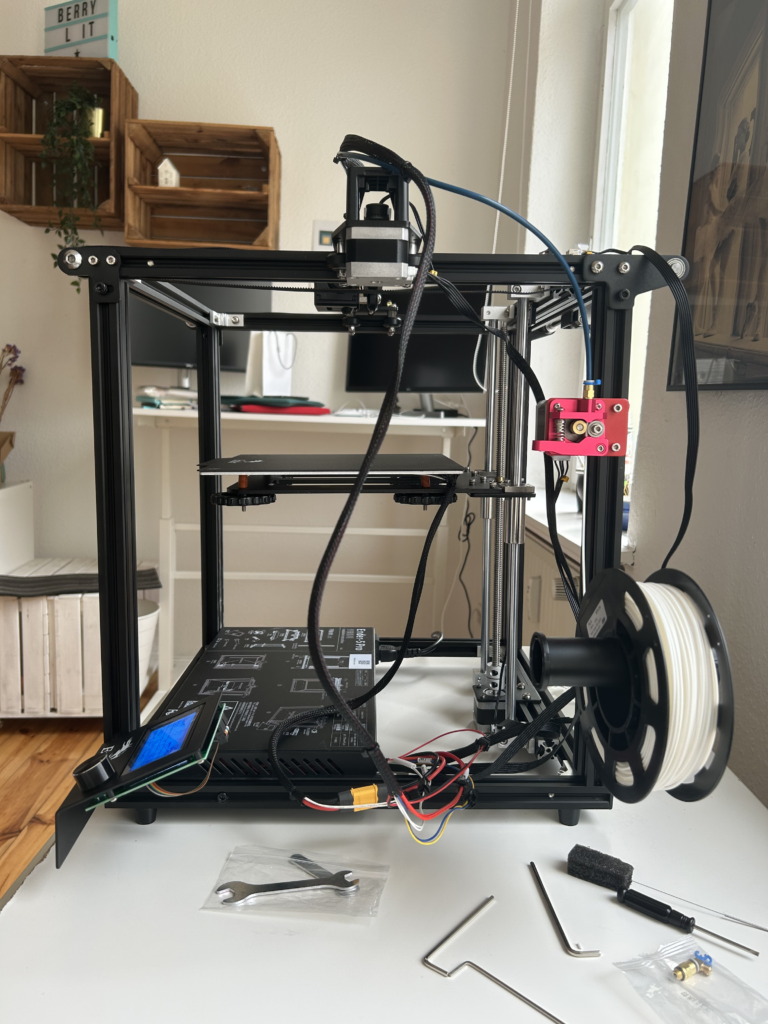
I’m also interested in data “visualization” for visually impaired people. I recently got a 3D printer that I’ve started setting up, because I’d like to explore three-dimensional data representations. I sometimes feel like the alt-text we write to describe our charts is not enough and I want to expand the data vis field beyond what it is commonly known for and make it accessible for everyone.
Outside of data vis, I started playing the cello at the age of 17, but I stopped when I moved to the United States in 2015. Now that I’ve moved to Berlin (and after almost 8 years without playing) I’ve decided to get back at it and resume my cello studies.
I want to teach and keep learning about data vis, and I can’t think of a better place to do that than Datawrapper.
I ran into Datawrapper in late 2017, when I first became interested in data visualization as a field of study and practice. Going through some of Datawrapper’s blog posts on data vis best principles, the use of colors, pie charts, etc., I was excited to find out there were people writing about topics in data vis and treating it as a discipline and career. I became a huge fan of the blog and the Data Vis Book Club (I joined a few sessions). Datawrapper, together with other online courses, books, and the incredible community, served as a data visualization school for me. The same way Datawrapper taught me the essentials of data vis, I hope to support our users and those just starting out.
So pumped to be joining the @datavisclub next month to discuss @giorgialupi’s and @stefpos’s #ObserveCollectDraw! 📊 🤩 cc @lisacrost #dataviz
— Guillermina Sutter Schneider (@gsutters) July 30, 2019
👓 Learn more at https://t.co/DOVkaW9Qck pic.twitter.com/QzwAcbnTZR
At Datawrapper I will be helping our customers and users get the most out of the tool through onboarding sessions and public webinars for all levels. These sessions will help us get a better understanding of our customers’ and users’ needs so we can keep improving the tool itself as well as our help docs, self-service training materials, and video tutorials. Last but not least, as part of the customer support and success team, I will sometimes be replying to your questions at support@datawrapper.de.
Welcome to the team, Guillermina! It’s great to have you with us. You can see more from Guillermina at her website, sutterschneider.com, or follow her on Twitter @gsutters.


Comments