This article is brought to you by Datawrapper, a data visualization tool for creating charts, maps, and tables. Learn more.
The Great Drowning of Men
The “Grote Mandrenke” was a severe tidal flood in 1362

Hi this is Hendrik, backend developer and system administrator at Datawrapper. Having just finished updating the backing data of our locator maps, and also being impressed by Ivan’s remake of a famous historical chart by William Playfair, I thought: How about taking the features of an old map and putting them on our current locator maps?
Being born near the coast of the North Sea in Germany, I learned what dikes are and why we need them as early as in elementary school. I also learned that tidal floods had devastated the lands over and over again, with the coast line changing a little each time.
The North Sea as we know has only existed for a little more than 8000 years. In geological terms that’s nothing. It first formed with the rising sea levels after the last ice age, filling the land between today’s Great Britain, Germany, and Denmark. Here are some nice maps showcasing the process.
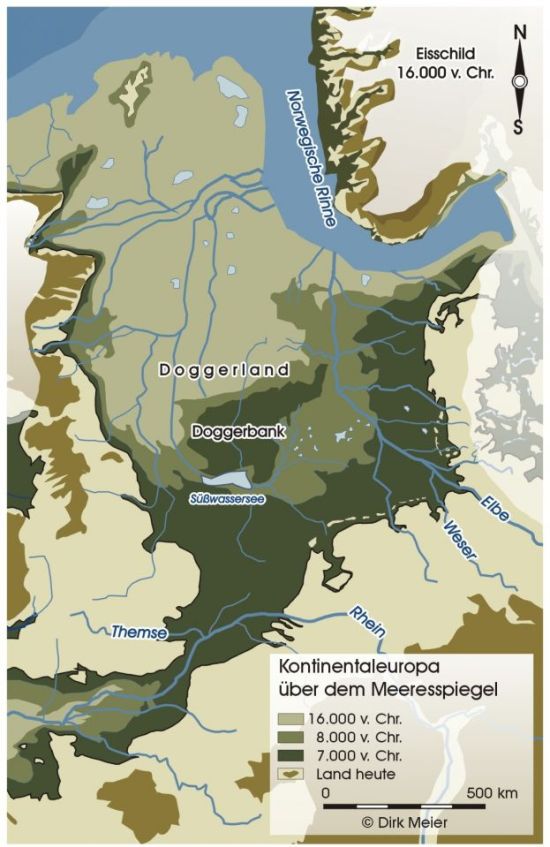
The sea level has been rising slowly ever since. Because most of the land around the North Sea is very flat, we have strong tides, and when these add up with a huge storm, we call that a “Sturmflut” (storm tide).
The people inhabiting the coast have always tried to protect themselves from these floods by building their homes on small artificial hills and building dikes along the water. But a strong tide can still break through.
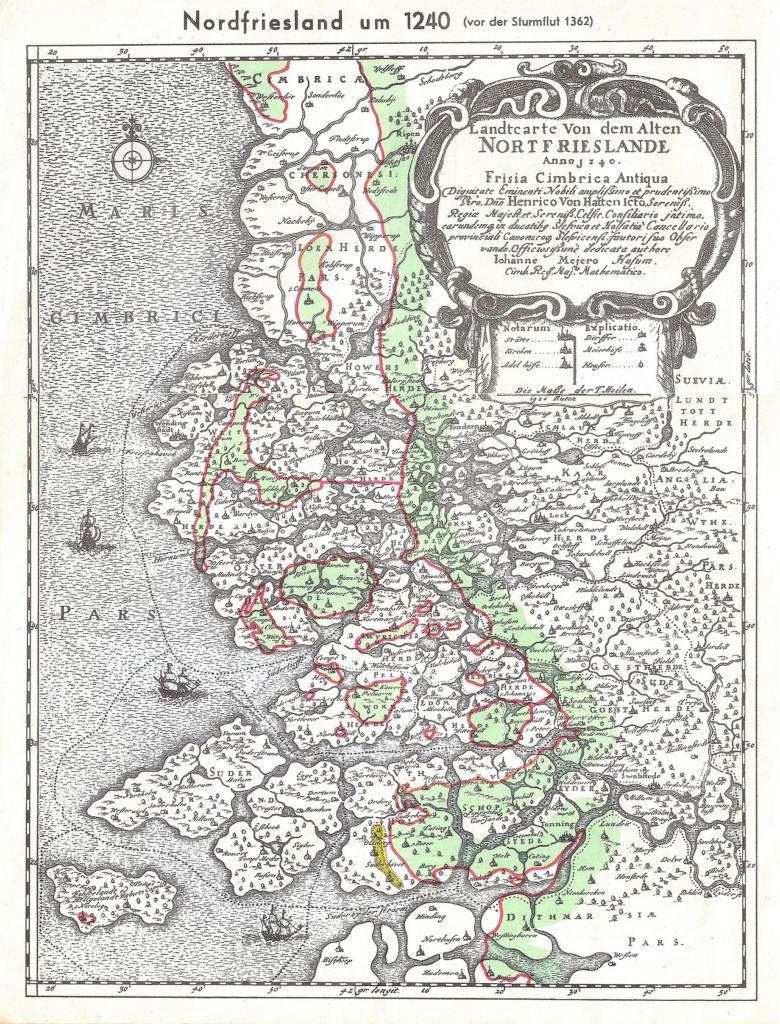
This map shows the North Sea coast as it was 1240 CE. The dikes of that time were only about 2.5 meters high, and agriculture behind them was drying out the land and making it sink. In the winter of 1362, a massive storm tide came in as high as another 2.5 meters above the dikes in some places, flooding the lower lands they were protecting. Between 25,000 and 100,000 people lost their lives, and 30 to 40 villages were erased. It was known as Saint Marcellus's flood or the Grote Mandrenke — the Great Drowning of Men.
Because of the flood, vast areas of what is shown here got lost to the sea and never resurfaced. People were never able to regain their old lands, given that they lived in small groups with only the tools of the Middle Ages. Today’s dikes are about 9 meters high and they are promised to hold up to rising sea levels until 2040. (That is, if we haven’t underestimated the effects of climate change.) The countries on the coast of the North Sea have agreements about this, which are especially important for the Netherlands, where lots of the land is already below sea level today. The sea doesn't stop at country borders, and if your neighbor has weak dikes, the water might just take the easiest way to get to you.
How I created the map
At first I asked the Bundesamt für Kartographie and Geodäsie if they had some old maps in digital. They did not, but they kindly replied, so I want to mention them here.
I wanted to go farther back than any digital maps go, so I had to start from the beginning, take a scan of an old map and digitize it myself. My choice fell on a map attributed to Johannes Mejer, who made it in 1649.
To be able to draw shapes on the map, I first needed to align it with a modern one, a process called geo-referencing. To my surprise, nothing really fit. Although Mejer was a cartographer and mathematician, today's mapping projections were not yet known in his time and people in the Middle Ages had simply forgotten how to measure land as exactly as in ancient times. That's probably why we don't have digitized maps from that time.
There were actually three maps I had to align. There’s the standard modern maps of the area; then I had some cities from Mejer’s map that still exist today; and someone unknown had drawn a sketch of today's coastline on top of Mejer’s map, though unfortunately in a way that made no sense with the actual distances of today's islands.
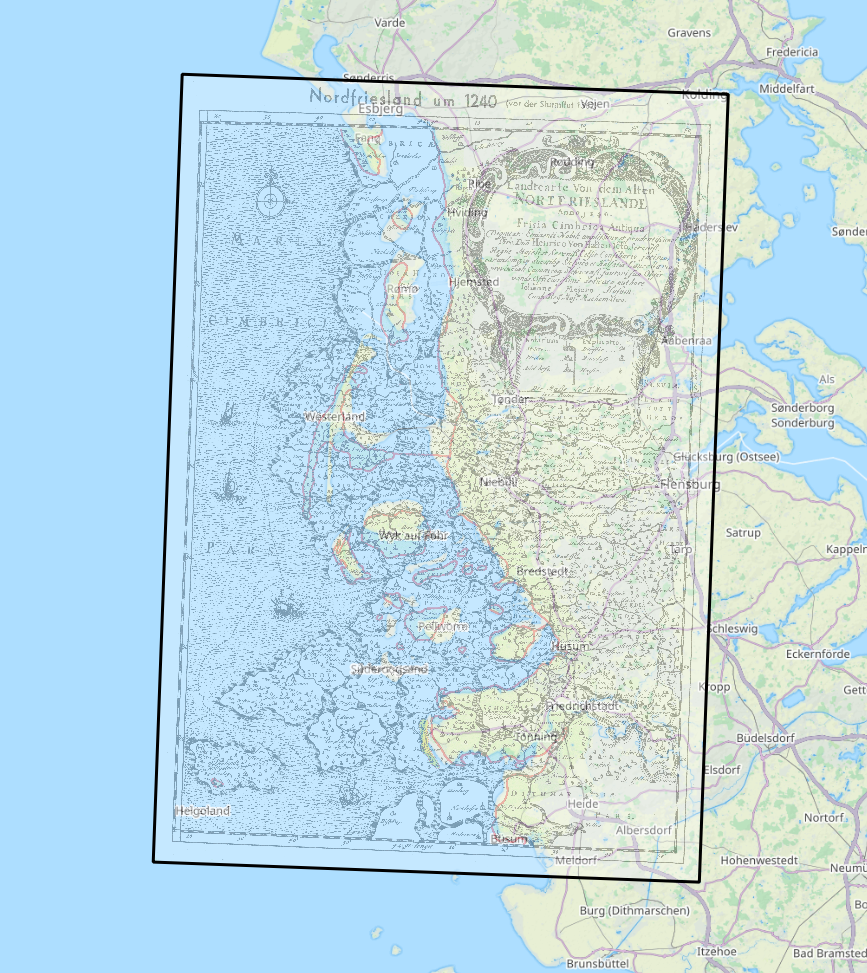
I ended up going for the least common error and got the map you see above. Still, islands like Sylt and Pellworm are far off from the place where they would seem to be from Mejer’s map, and Helgoland in the southwest corner of the map is actually supposed to be the tip of the large island beneath it.
The shape of the mainland has changed over time as well, which means some medieval islands overlap with the modern coastline on my map. Other shapes that look like islands are actually just places where the mainland coast used to stick farther out.
Some last words on the tooling
I used QGIS for the geo-referencing of the map, but actually drew the islands on the screen with a stylus using Inkscape, adjusting every single vertex with the mouse later — a process that took me two work days. I wasn’t aware at that time that I wouldn’t actually need that level of precision for a small locator map.
Using Inkscape also gave me a hard time finding a common format to get the polygons back to QGIS, as QGIS wouldn’t open Inkscape’s SVG. I had to export to AutoCADs DXF format (with hand tweaked options), in order to get at least the undamaged outlines of the polygons over to QGIS again.
From there it was only a small step to a simplified GeoJSON that could be used with Datawrapper.
That's it for today. I actually learned a lot about mapping doing this and I hope I can bring those new skills to use at Datawrapper.


Comments