New: Small multiple column charts in Datawrapper
February 18th, 2025
6 min
Datawrapper lets you show your data as beautiful charts, maps or tables with a few clicks. Find out more about all the available visualization types.
Our mission is to help everyone communicate with data - from newsrooms to global enterprises, non-profits or public service.
We want to enable everyone to create beautiful charts, maps, and tables. New to data visualization? Or do you have specific questions about us? You'll find all the answers here.
Data vis best practices, news, and examples
250+ articles that explain how to use Datawrapper
Answers to common questions
An exchange place for Datawrapper visualizations
Attend and watch how to use Datawrapper best
Learn about available positions on our team
Our latest small and big improvements
Build your integration with Datawrapper's API
Get in touch with us – we're happy to help
This article is brought to you by Datawrapper, a data visualization tool for creating charts, maps, and tables. Learn more.
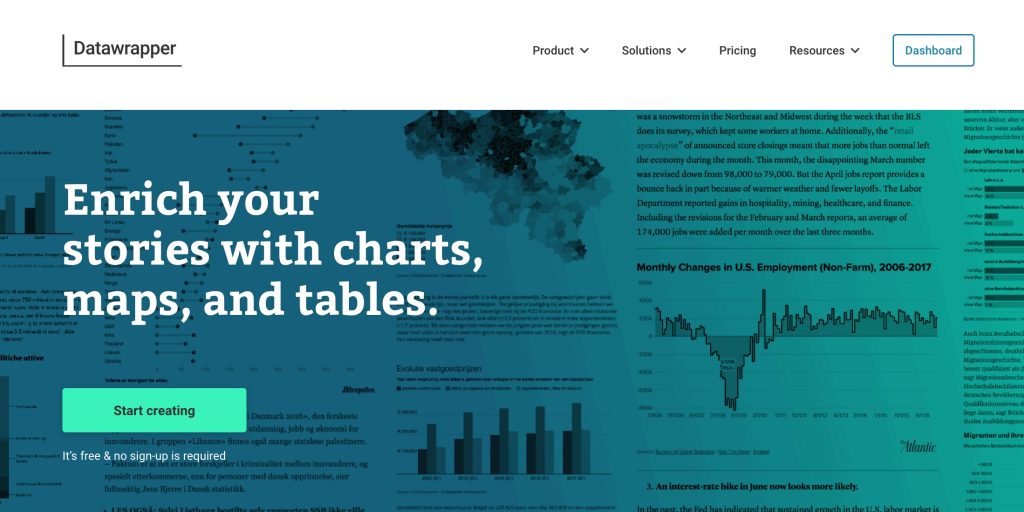
We’re happy to share big changes we made to datawrapper.de and blog.datawrapper.de. Here’s what’s new:
The main goal of our website redesign was to make it easier for potential users to decide if Datawrapper is a good fit for them. The overall look & feel is still similar (click here to look at the last redesign from 2017), but there are lots of additions and new features:
You can now find overview pages for charts, maps, and tables that come with examples, explanations of features, and – on the charts page – a visualization type picker.
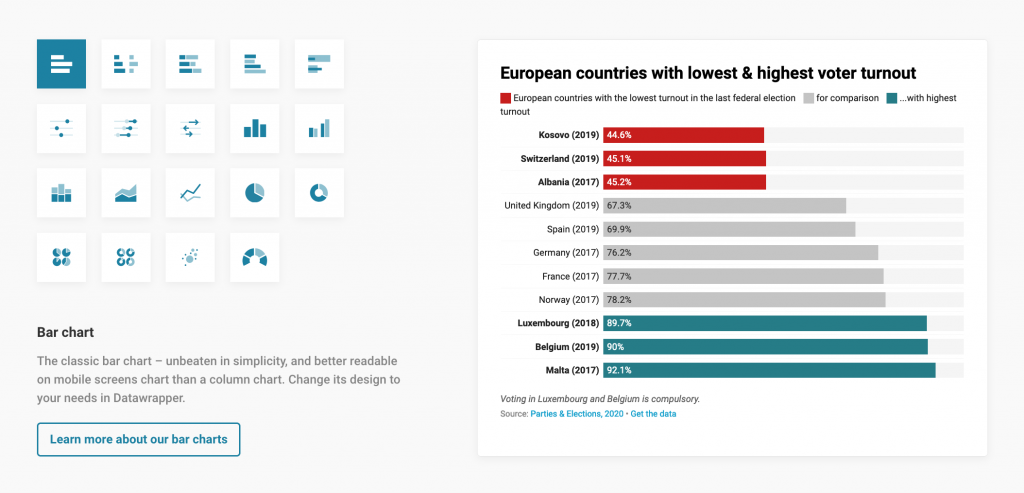
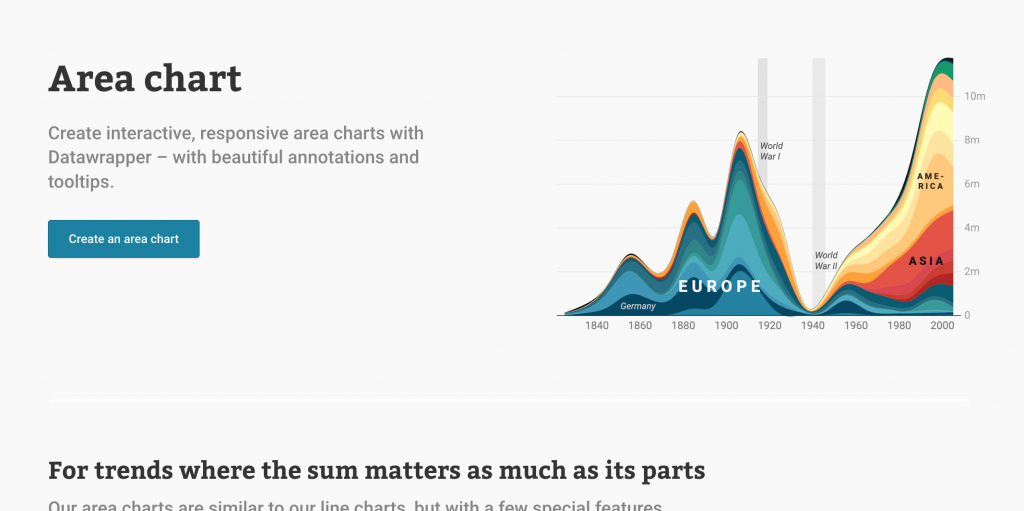
There’s also now a separate page for each map and chart type, for example for choropleth maps, area charts, or multiple donuts charts. You’ll find information about what to use each chart type for, how to create them with Datawrapper – and you can directly jump to examples from the Datawrapper River.
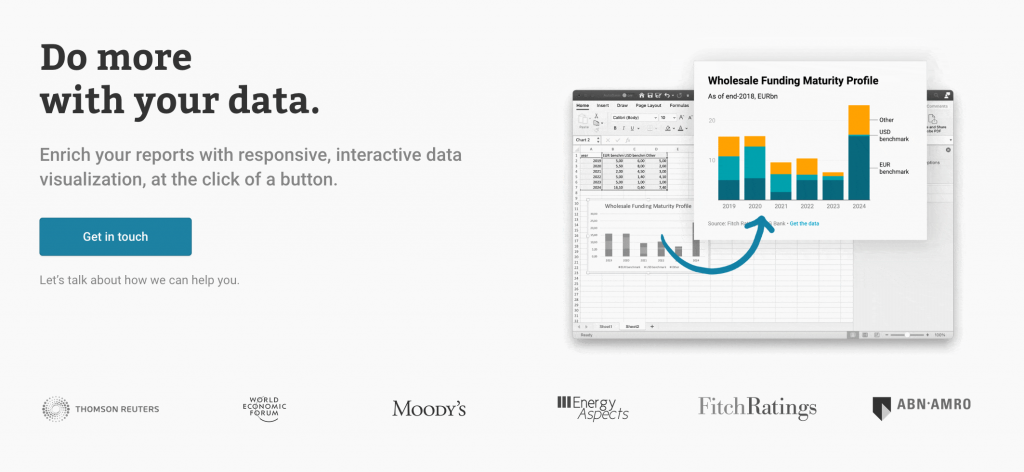
We also added Solutions pages: To inform potential users in media, finance, and government about the benefits of Datawrapper, we added a page for all of these industries, with links to relevant case studies.
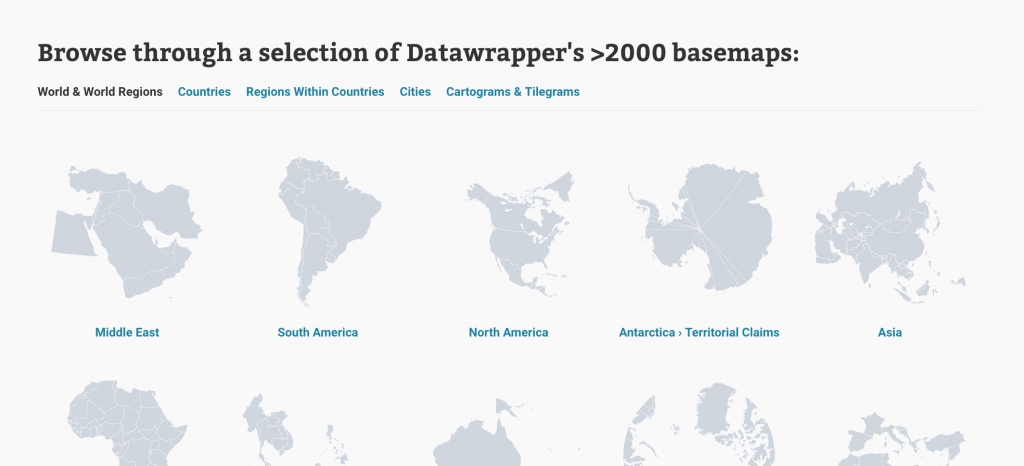
Also new: A page to search through our basemaps. We offer more than 2,000 basemaps – world maps, regions, countries, regions within countries, and cartograms – that you can use to create choropleth and symbol maps. Now we have a proper subpage to show you a selection and let you search through all of them. (You can still search through them in our app like you’re used to!)
We improved our blog layout to enable people who’ve never been to our blog before to a) understand what it’s about and b) find the content that’s most interesting to them.
A more structured home page: Visitors get now get introduced to the blog with a little text and better explanations of what e.g. Weekly Charts are all about. We also highlight articles that may be not the most recent, but still highly relevant. In the old blog, they would have been pushed down the page by new articles. Now we can make you aware of them. (You can still find a chronological list of all articles here.)
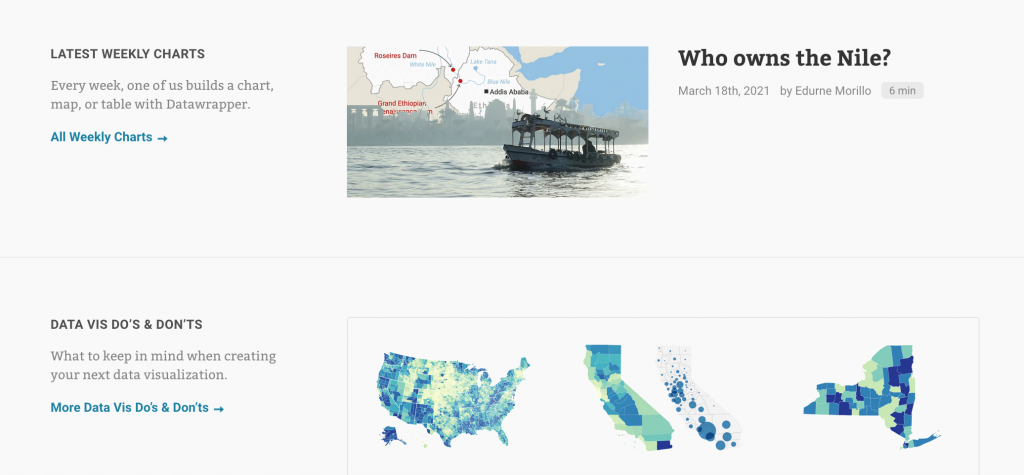
More categories: The old blog didn’t have the space to group blog posts into categories – now, it does. We have categories like Data Vis Do’s & Don’ts, Color in Data Vis, Team News, How to deal with data, Data Vis Book Club, Climate visualizations, COVID-19 visualizations, and How others use us. You can find them all at the bottom of each blog post.

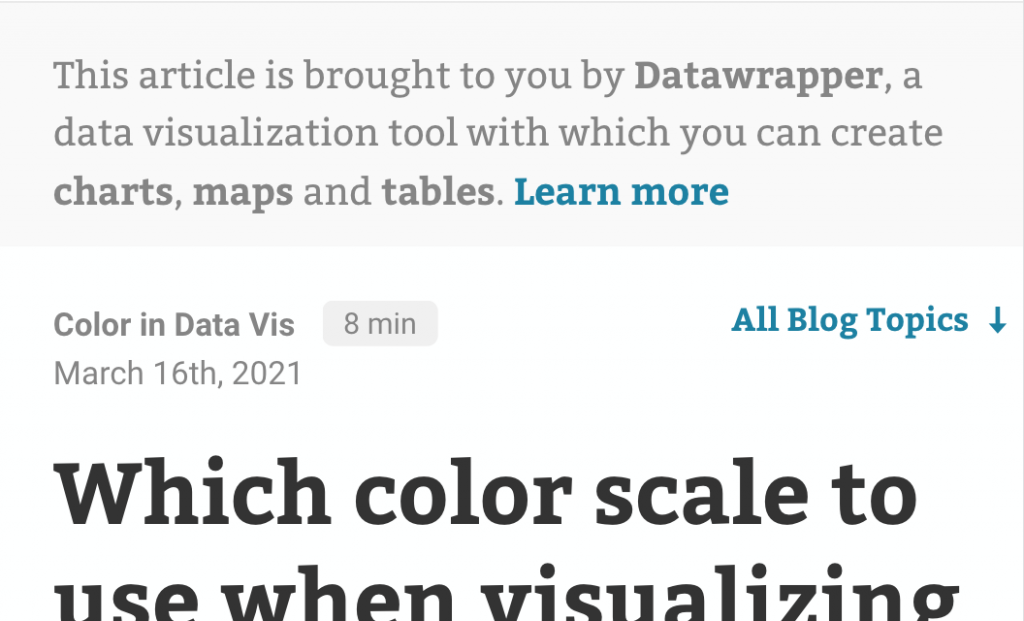
A small hint about what Datawrapper is: We wanted to introduce ourselves to people who’ve never heard about Datawrapper and find themselves on one of our blog posts. But we don’t like company blogs that use pop-ups, sticky ads on the side, or in-between paragraphs to tell us, again and again, that we should use their product. That’s why we added just a subtle hint in grey at the top – and then we get out of the way and let you read the article.

A new (old) name: The Datawrapper Blog is now called Datawrapper Blog, not Chartable anymore. The name didn’t stick – people didn’t use it when referring to our blog –, so we decided to get rid of it.
The Datawrapper Blog started out as a WordPress site many, many years ago. We then moved to Medium, and then – for more control – to the static site generator Hexo. Now we moved back to WordPress. We had different reasons to do so:
To make our site faster and more secure, we turn our pages into static files with the help of the service Strattic.
We’re very happy to finally show you our new website and blog and hope you find it useful. Do you have any feedback or found any flaws in the new design? Let us know at support@datawrapper.de or in the comments below. As always, we’re looking forward to hearing from you.
Comments