We’re hiring a Werkstudent*in Social Media & Communications
October 15th, 2024
4 min
Datawrapper lets you show your data as beautiful charts, maps or tables with a few clicks. Find out more about all the available visualization types.
Our mission is to help everyone communicate with data - from newsrooms to global enterprises, non-profits or public service.
We want to enable everyone to create beautiful charts, maps, and tables. New to data visualization? Or do you have specific questions about us? You'll find all the answers here.
Data vis best practices, news, and examples
250+ articles that explain how to use Datawrapper
Answers to common questions
An exchange place for Datawrapper visualizations
Attend and watch how to use Datawrapper best
Learn about available positions on our team
Our latest small and big improvements
Build your integration with Datawrapper's API
Get in touch with us – we're happy to help
This article is brought to you by Datawrapper, a data visualization tool for creating charts, maps, and tables. Learn more.

We’re very happy to introduce you to a new member of the Datawrapper team: Elana Levin Schtulberg. She will help you with all questions Datawrapper-related and will teach our tool in newsrooms. Elana’s filling the Support & Training position we blogged about in April. She happily answered our questions, so that you can get to know her better:
Hey there 🙂 So, where to start… I’m half Swedish, half Russian, was raised in England, where I studied physics and graduated with a masters in 2014. Since then I moved to Berlin, learned German and started studying Visual Communications here.
I guess it was during my physics degree that I first really learned the importance of and got a taste for visualizing data. This was compounded after my degree during a brief foray into the world of equity research. But as it turned out, neither the focus on science nor the focus on money were really for me and it didn’t take me long to realize that I instead wanted to pursue my creative interests. So I applied for and got accepted to study Visual Communications at the University of Arts here in Berlin.
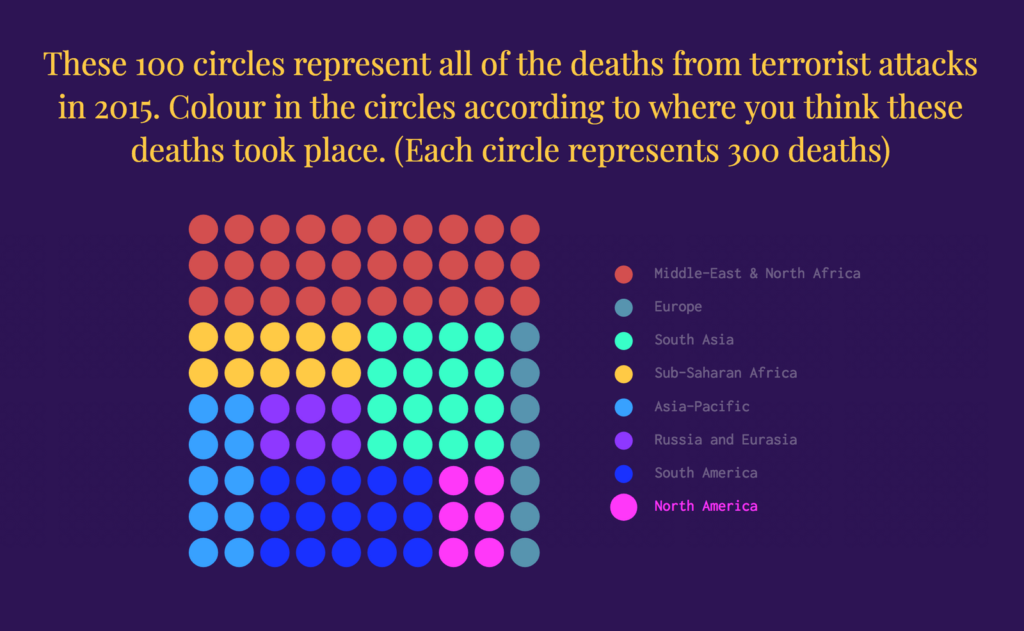
It was during the course of this degree, around this time last year, that I first became conscious of (and then obsessed with) the exciting world of d3 and (interactive) data visualizations. I devoured everything I could find online with great excitement and threw myself into d3. Whilst researching for one of my university projects, I came across The New York Times’ ‘You Draw It’ concept. This fascinated and inspired me with the idea of using ‘fill-in-the-blanks’ interactive data visualizations as an educational tool and a means of confronting people with their understanding of various political situations (or lack thereof). One example of these that I made can be found here:

I’m going to be the interaction point between all of you and all of us. If you ever run into any problems, need some help with Datawrapper, notice any bugs or have anything else you feel we should hear about, just send us an email at support@datwrapper.de. I will be the one sitting on the other end and be dealing with your request – advising you, helping you with your problems, or, when necessary, passing them on to whichever Datawrapper team member they should be passed onto. I will also make sure to keep you updated on the progress of your query.
Another part of my job involves Datawrapper training and outreach. I will be giving workshops to interested customers, in newsrooms, at universities, wherever you need it really – both in person and online. Please do not hesitate to get in touch if this is something that you think your team could be interested in!
As I mentioned earlier I’ve been into data vis for about a year now, so when I again found myself browsing Gregor’s online portfolio back in April – in the process stumbling across Datawrapper and seeing that there was a vacancy – I knew I just had to apply. Aside from my interest in data visualization, I also really love helping people. In the past, I’ve tutored, led fun physics teaching sessions for school kids and volunteered to teach German to refugees. I’ve always noticed how helping people and passing on knowledge are two things that give me great pleasure and satisfaction. This position at Datawrapper seemed like the perfect way to combine this side of me with my creative-but-nerdy, data-vis-enthusiast side. And let’s not even mention my excitement at the prospect of getting to work surrounded by so many talented people with such a passion for data visualization! I’m extremely excited to be a part of the Datawrapper team and look forward to the time ahead 🙂
Just briefly on the topic of languages, feel free to write me in English, German or even Swedish. Though I can unfortunately only guarantee a flawless reply in English! And yes, I know I said I’m half Russian, but unfortunately I don’t speak it, so for any Russians out there… pick one of the other three languages! 🙂
Thanks to Elana for answering all our questions, and welcome to the team! If you want to get in touch with her, find her on Twitter or just write to support@datwrapper.de.
Comments