

We’re hiring a UI / UX designer with experience in data visualization
June 28th, 2024
6 min
This article is brought to you by Datawrapper, a data visualization tool for creating charts, maps, and tables. Learn more.
Hey! My name is Vivien. I was part of October’s hiring wave and am now a working student in the communications team at Datawrapper. Since blogging is part of comms, I have the strange honor of writing this “Say Hi” article myself. So get ready to read me interviewing… me.
I’m an interface design student at the University of Applied Sciences Potsdam. I love fall, boots, and sitting in trains. I don’t really like coffee but drink it because I like the feeling of drinking coffee. The Hobbit was the only movie that ever made me leave the cinema (sorry it’s just the worst). And even though I really try to be experimental, I keep coming back to the same Indian restaurant, sitting in the same corner and eating the same dish.
My main task is to create the Data Vis Dispatch together with Rose. It’s our weekly blog format where we show the past week’s best and most beautiful data visualizations. You may have already spotted the new byline at the top of the Dispatch — that’s me!
Basically, I check up to 200 different sources, news articles, X/Twitter posts, Mastodon posts, and RSS feeds, and then select, collect, cut out, do background research, cluster, write, and publish. I don’t want to brag, but I would call myself a screenshot pro.
I’ve always struggled, and honestly still do, with the fact that there is no linear path that led me perfectly to interface design and now to working in data vis. After my undergraduate studies in design, I was asked how I would describe my life path so far. This simple question turned into a three-day, fast-food-only soul searching until I finally came up with the term: “Versatzstückrealität.”
Instead of a path, I picture a theater set, with different pieces moving on and off stage. Working with disabled kitchen staff, managing the bar at Theater des Westens Berlin, and being a cleaner and reading supervisor at the Berliner Büchertisch all set the scene for what I do now, just as much as my work as a designer and front-end developer at Helmholtz Zentrum Berlin and as a workshop leader at Futurium.
Long story short: During my studies, I developed a great interest in data visualization. (For the long version, just skip to the next question 😉) A few months ago, I decided to strengthen this interest and make it my profession. I signed up for the Apropos DataVis workspace, carefully curated by Marian Dörk, and not even a week later, the job offer from Datawrapper fluttered in there. I guess that’s what people call a perfect opportunity. And that’s it: the very short but all the happier story of how I ended up at Datawrapper.
While studying interface design, I experienced all the accusations you encounter in this particular field. “You just make everything pretty and promote consumerism,” for one example. When I took my first data visualization course, an answer opened up for me: I could creatively visualize data and phenomena, and at the same time deal with real people, situations, and destinies, learn how to handle data and how many dimensions of visualization there really are. That’s not just making things pretty, is it?
One project that really strengthened my interest was “Co-op.comm” — my attempt to visualize the complex communication structure of cooperatives. The work is based on interviews with people who work and live in a cooperative environment.
Like almost every design student (or just every student) I know, I’m sometimes drowning in side projects. But I’m not complaining at all, because it was these side projects that ultimately led me to design. One particularly dear to my heart was SÆX Fashion (I know, we were young and funny).
SÆX was a collectively run company, basically just me and four friends who wanted to create organic clothing. We ordered a silk screen printing press and all of a sudden I found myself in the role of print designer, learning to use the graphics tools, organize photoshoots, and work with my friends.
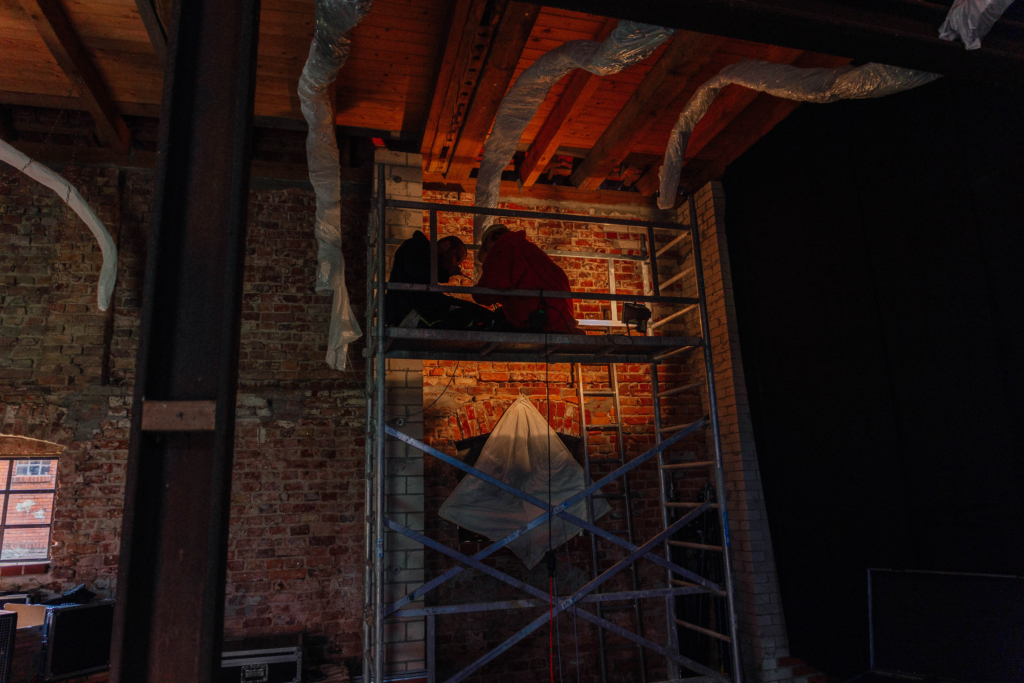
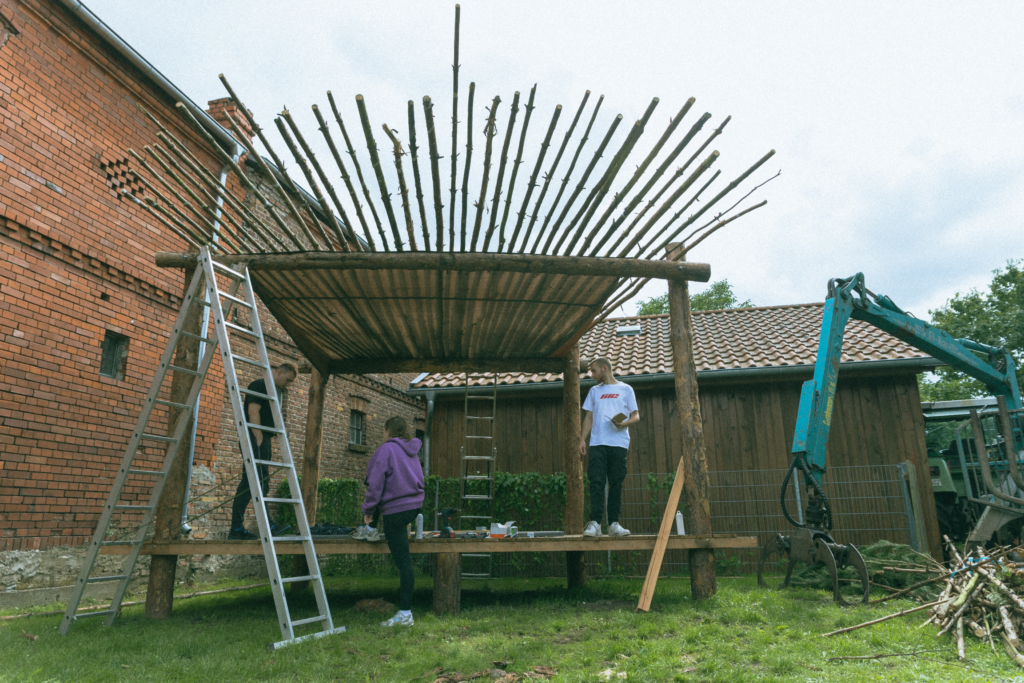
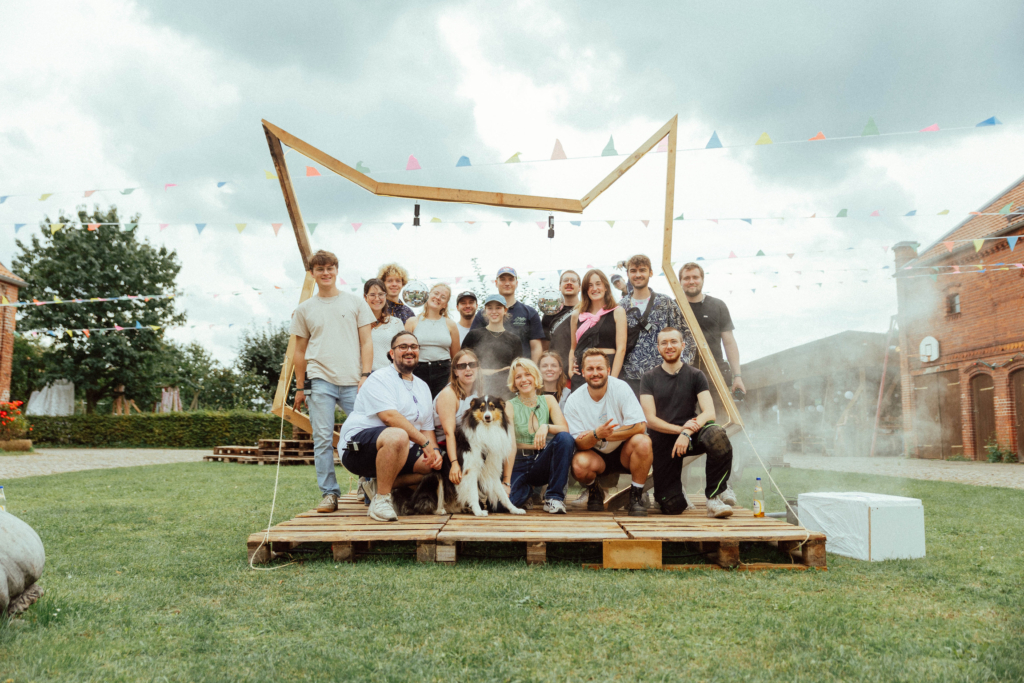
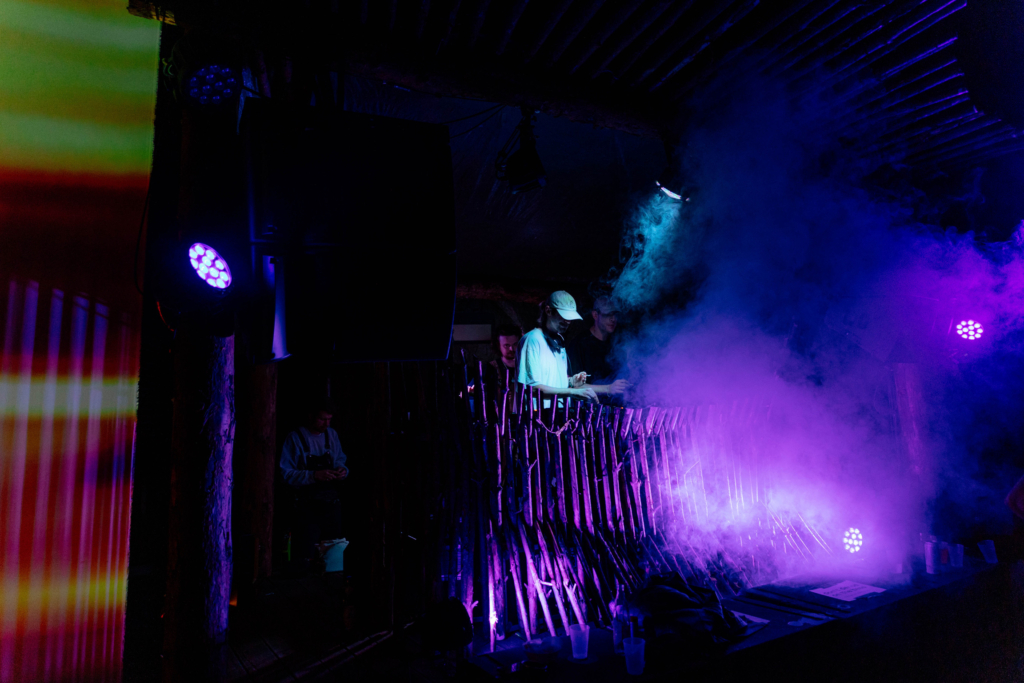
Working with my friends never stopped. Just two months ago, we hosted a festival: Garfield. (Yep, another great name — but it was in Garlitz on a field, so don’t make fun.) We worked for about a year to bring Garfield to life, and again I found myself in a position I didn’t expect: planning and creating the site and stage design. I soldered light installations, sawed trees, helped build stages, and spent hours making decorations.
I don’t know what future projects I’ll be most proud of, but I can’t wait for them to come.
Phew, how do you end an article about yourself? All I want to say is: I’m excited to work at Datawrapper, to get to know this nice team even better, and I’m grateful that the Dispatch gives me such a perfect opportunity to see data visualizations every week, to be inspired, and to enter the world of data visualization.


Comments