We’re hiring a Werkstudent*in Social Media & Communications
October 15th, 2024
4 min
Datawrapper lets you show your data as beautiful charts, maps or tables with a few clicks. Find out more about all the available visualization types.
Our mission is to help everyone communicate with data - from newsrooms to global enterprises, non-profits or public service.
We want to enable everyone to create beautiful charts, maps, and tables. New to data visualization? Or do you have specific questions about us? You'll find all the answers here.
Data vis best practices, news, and examples
250+ articles that explain how to use Datawrapper
Answers to common questions
An exchange place for Datawrapper visualizations
Attend and watch how to use Datawrapper best
Learn about available positions on our team
Our latest small and big improvements
Build your integration with Datawrapper's API
Get in touch with us – we're happy to help
This article is brought to you by Datawrapper, a data visualization tool for creating charts, maps, and tables. Learn more.

Whether you have questions about creating your first chart ever, or are designing a new custom theme, we want to help you get the most out of Datawrapper. That’s why we’re excited to introduce Shaylee Safie, the newest addition to our customer support and success team. She’ll be filling this role, working five days a week alongside Elana, Aya, Margaux, and John.
Let’s get to know her with a few questions!
Yes! I’m Shaylee (she/her), I’m an American who recently made the jump to Berlin all on my own. I had never been outside of North America before I visited Berlin on a solo trip in the fall of 2021, and shortly after arriving I knew I was ready to move my life over. I fell in love with the quality and pace of life in Berlin, the art that’s absolutely everywhere, the ease with which people interacted and, yes, the food. (Whoever said food in Germany was bland never tried a döner kebap mit scharfer Soße!)
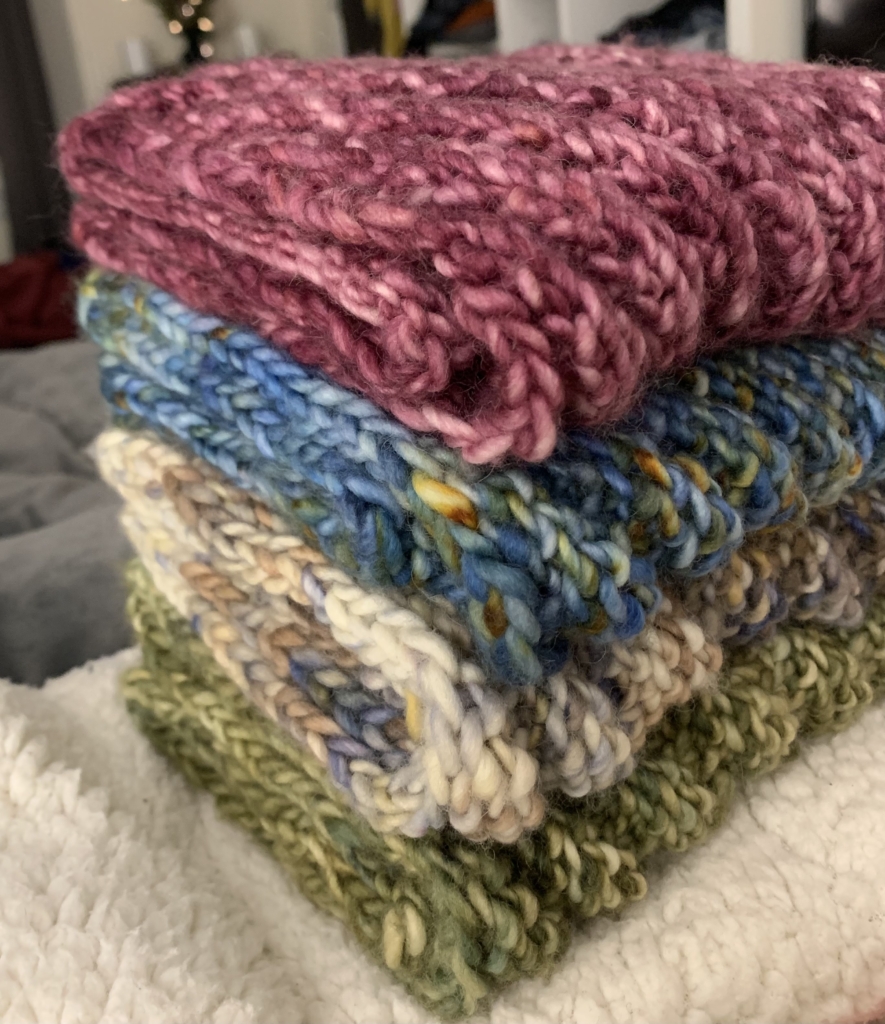
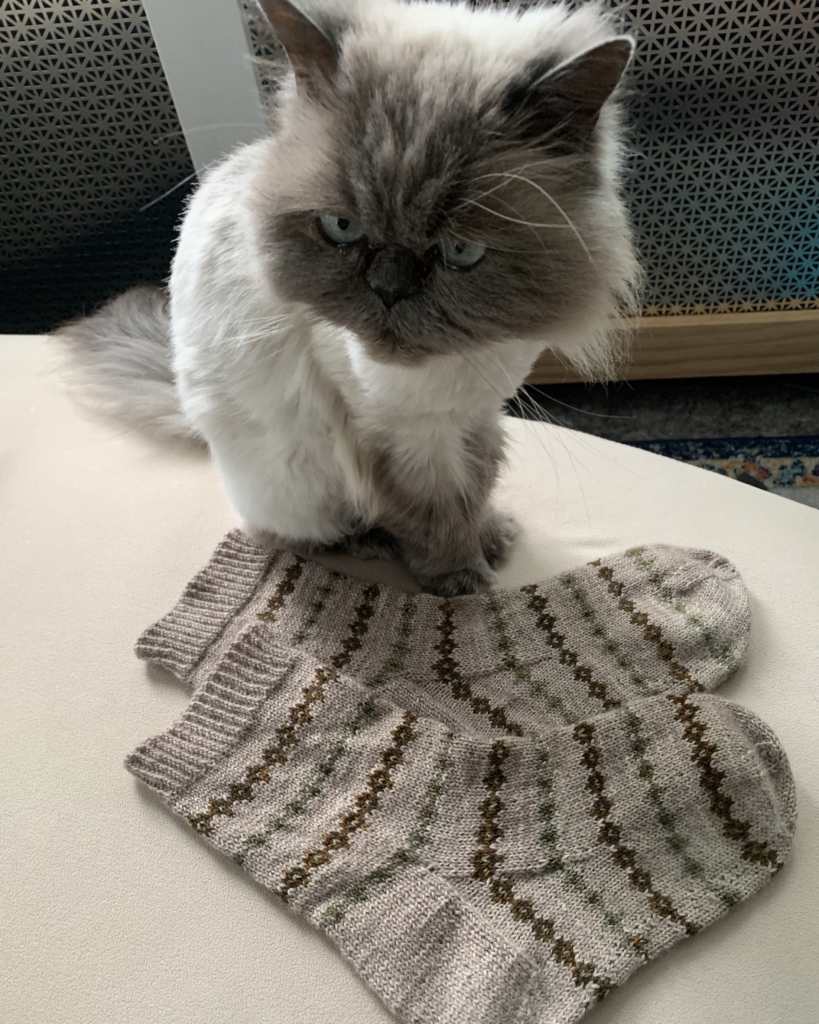
Before I began studying German and expat blogs, I studied communication at Temple University in Philadelphia, with a concentration in policy, regulation, and advocacy. In my free time, my interests also include knitting and fiber arts, podcasts, conversations about the systems we live in, reading (especially narrative nonfiction and literary fiction), traveling when it is safe to do so, and participating in mutual aid work.


I’ve been working pretty much non-stop since I was 16 years old, with many of those years in food service and hospitality, and I also have 7 seasons of experience packing parachutes for skydivers. I estimate I’ve worked on the gear for over 6,000 skydives, and every single one has landed safely — including one that I jumped myself!

One of my favorite opportunities in college was when I got to study podcasting with WNYC and WHYY producers — it was a bit of a dream for me as a public radio nerd! With their guidance, I created a short spotlight segment on the South Philadelphia neighborhood, using conversations I had with residents and pedestrians in the Italian Market area. I still have a lot of love for this piece and the project we created together. (You can check out the whole series, created by our very talented class, here.)
I had been thinking about ways to pivot into the tech industry for some time, and I was seeking an organization that would see value in my existing skills, background, and ability to contribute to a team while also still learning and progressing in my own right. As soon as this opportunity at Datawrapper presented itself, I realized what a cool field data visualization is, and was really fascinated with the multitude of ways people can combine data with storytelling. It seemed like icing on the cake that Datawrapper has such a welcoming and supportive company culture and is firmly rooted in a philosophy of accessibility, which is really important to me personally. In all, this job seemed like a perfect fit!
I’m on the support and success team, so if you reach out with a question to support@datawrapper.de, I might be the one behind the reply! I’m also learning more about data visualization and web development, as well as learning about how people use Datawrapper.
Outside of my core responsibilities, I have plenty of interests across the board, so stay tuned to the Datawrapper blog — you may see my name pop up on other projects in the future!
Welcome, Shaylee! It’s great to have you here. You can read more from Shaylee by visiting her portfolio website, or tuning in next Thursday for her very first Weekly Chart.
Comments