

Read “Chart Spark” by Alli Torban with us!
June 17th, 2024
6 min
This article is brought to you by Datawrapper, a data visualization tool for creating charts, maps, and tables. Learn more.
A little bit over a month ago, I and some other Data Vis Book Club attendees gathered in a digital notepad to discuss what we’d read in the past weeks: Shirley Wu and Nadieh Bremers’s book “Data Sketches,” which came out at the beginning of the year. It was the 12th book our book club has discussed. (Find the announcement here.)
And wow, we really liked the book! So much that we spent the first 45 minutes explaining to each other what was great about it. (You can read the documentation here. And our regular Neil Richards wrote a review of our discussion. Thank you, Neil!) Out of all attendees, Tiago Maranhao had the best love letter to the book:
Omg, I loved this book so, so much. I had read some of the write-ups online when they came out, but having them “materialized” in such a beautiful book gives them another dimension. Sometimes stuff on the web seems so “impermanent,” and I think the book really honors the work, the dedication, the generosity of sharing, teaching, opening up.
I work full time and have two kids, so after everybody goes to sleep, that’s when I try to study or learn something new. And in the last few weeks, I would sneak into the office (because you need a table to read such an enormous book!) and read (savor?) a couple of chapters.
It was so delightful — it was like listening with the mind to two wonderful human beings recounting their ideas, their excitement, their frustrations. Like I was listening to two friends talking about their latest exciting projects, their joys, their challenges.
After 45 minutes, Nadieh and Shirley joined us to answer all the questions we had about their book. And we really liked their answers too! I found their opinions so thoughtful and refreshingly honest that I decided to get Nadieh and Shirley’s permission to show some of them here again, slightly edited. (You’ll see the names of some of our attendees sprinkled in between. Learn more about them in the intro section of our notepad.) And now: Enjoy!
Lisa We all obviously liked your book. If you ever had to write another one, what would it be about?
Nadieh The first thing that comes to mind is more full design journeys from some of my other (client) projects, which I already do now sometimes on my blog. But that would literally just be “Data Sketches: The Sequel,” without a collaboration and with some (sometimes frustrating) client constraints, hehe.
Tiago That would be so cool. I just loved the format you two used in Data Sketches — part memoir, part technical book, but always with that personal touch.
Nadieh I’m so happy to hear this! Keeping that personal touch and writing as if we were telling a story to a friend was a clear choice from our side to keep. (We’d done this for our internet write-ups, but we did discuss what would work best for the book for a bit.)
Tiago It was fundamental, I think. I think we all became very attached to the book, to your voices, thanks to that personal touch. And I loved those little side notes, like post-writings comments… they add another delightful layer to the text! 🙂
Ruth How did it feel to be so open about your process and talk honestly about the lows as well as the highs?
Nadieh I guess it kind of comes naturally to me to want to share the full journey. I think it also comes from a personal desire: I love to see other people talk about their highs and lows. It makes me feel more human/normal to think that the people I admire also didn’t come up with their final artwork/dataviz in one perfect go. I also found that I learn most from people that share their full design process, so I also think I wanted to emulate that. Plus, how else can we share some awesome bloopers!! (*cough* man peeing in puddle *cough*)
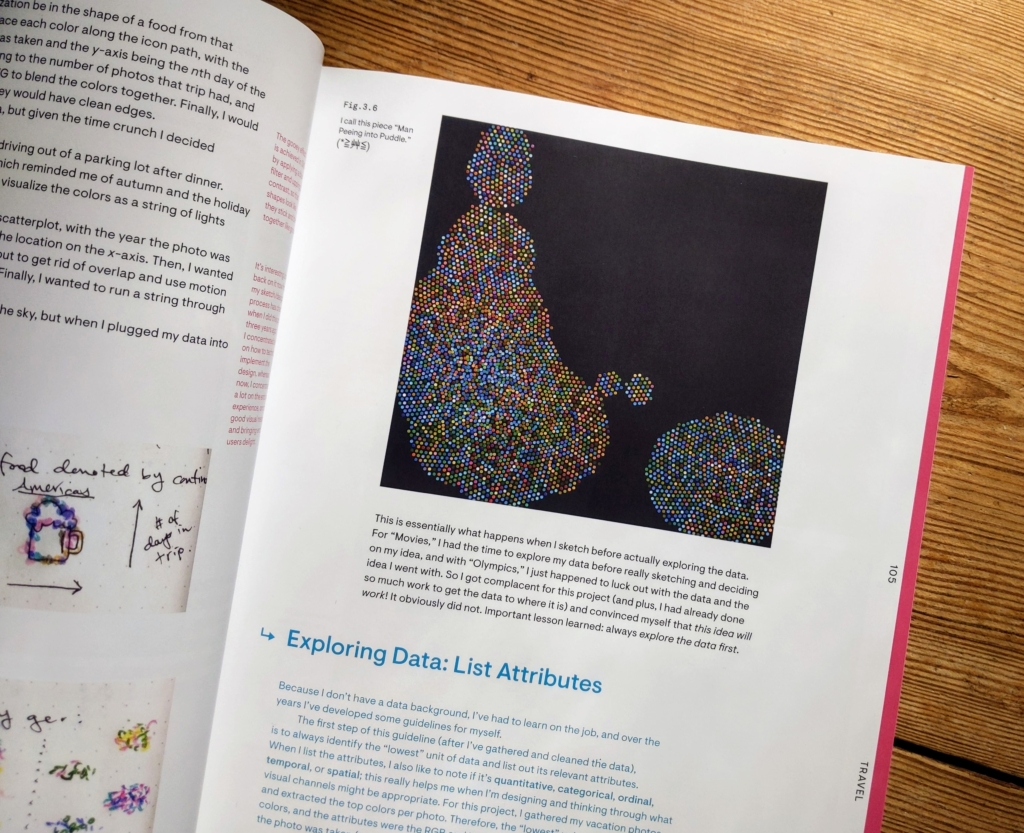
Shirley LOL OK I CAN’T BELIEVE THAT MADE IT INTO A BOOK.
Nadieh: I guess with a “next book” I would want it to be more focused on lessons about the design side. How do I/you go from a simple network visualization to one that hopefully looks awesome? It could be a book with my favorite tips to go that extra mile, to take a dataviz beyond the default. Although I’ve not been good at distilling my “process” into tips/learnings :S
Lisa I’d very much like that. There are far too few books that focus on design in data vis.
It makes me feel more human/normal to think that the people I admire also didn’t come up with their final dataviz in one perfect go.
Nadieh Bremer
Shirley Honestly Nadieh, I think you’re great at distilling your process, as evidenced by all of your talks even before we wrote the book (SVGs, networks) — perhaps it takes a while to do the distilling since it does take many projects to be able to start seeing a pattern, but it’ll be really worth it.
Lisa How about you, Shirley?
Shirley I’ve no idea actually! I think after a few years, when my memories of all the stress of writing a book have faded and I’m only left with the good memories, I’d love to do another one.
It’ll probably revolve around whatever next set of projects I decide to work on, I find it easier to write about my own work and explain the thought process behind them.
Julian What is your experience freelancing in data viz, are clients hard to come by? What would be your tips?
Nadieh I think I’ve been lucky in that I started freelancing when I already had a website and portfolio built up from personal projects, and some possible clients were already asking me to make things for them. When I did go into freelancing, I therefore didn’t have to scramble to find clients. I do have periods where hardly anything comes in and I get nervous, and then suddenly my next 3-4 months fill up within a week or two. Like they say, “It comes in waves.”
My biggest tip would be to have a portfolio. Show possible clients what you can make, what your style is, where you are technically. Dataviz is very visual, so I think it’s actually a good thing that we can make projects to show what we like to do. (In the sense that, if you were a freelance data scientist, I feel that it would be much more difficult to convince a client of your abilities when they just visit your website.)
Shirley Ooooh this is a big one. Clients were definitely hard to come by when I first started in 2016, and they started trickling in more when we announced Data Sketches in September that year. That’s when my name got out to the wider dataviz community. Then Hamilton got my name out there a bit more past the dataviz community. And the project with Google News Labs validated the hourly rate I was asking for at that time. Clients have been relatively steady since, with the exception of last year.
Neil Who are/were your dataviz inspirations?
Nadieh I know that my first were Jan Willem Tulp after seeing his Ghost Counties visual with which he won a ticket to Eyeo, and Giorgia Lupi after seeing the work she did for La Lettura, which was so different from all other dataviz I had seen before that. Mike Bostock also, in general, but especially during his time at the New York Times. I was amazed by how he could do magic with d3.js to create unique pieces (but he’ll always be like a god to me, with how he can code the most intricate things in just 20 lines of code!)

Shirley The first tie I saw Giorgia Lupi’s Eyeo talk from 2014, my mind was blown. Before then, I only thought that dataviz should be standard charts, so the experimental things I was coding on the side felt weird. But when I saw her talk and saw that data could be visualized in such non-standard ways, it suddenly clicked what I had been creating, without even knowing it, were the “eccentric” (Alberto’s words, not mine!) visualizations that I now have a lot in my portfolio. It gave me a feeling of validation. And if I go back even earlier than that, there was a TED talk by Aaron Koblin that I saw in 2011, and that talk was the talk where I decided I needed to make coding my career.
Neil Once you have decided on a visualization topic, what usually comes first — the dataset or the design idea?
Shirley The dataset! I learned very early on (pre-“Data Sketches”) to never design before I have the data, and even after I get the data, to not design until I have a good understanding of the dataset.
This is a really important rule for me, especially for client projects. I can spend all the time thinking up the coolest designs but I might find that as soon as I put data into it, the design doesn’t work. Maybe the design actually doesn’t show anything interesting, or it’s ruined because of outliers, or it just actually looks unappealing.
I can spend all the time thinking up the coolest designs but I might find that as soon as I put data into it, the design doesn’t work.
Shirley Wu
The only time I was successful in coming up with a design idea pre-dataset was my Movies project where I had the sunflowers idea even before I went and got the dataset, but that’s only because that design is a straight mapping of data to marks/channels and doesn’t try to showcase anything in particular about the dataset itself (and honestly could have been created with any other dataset).
Gabriela I feel like this rule should be in a big poster to put behind my desk: “Don’t start designing until you have a good understanding of the dataset!”
Shirley It’s so hard! Sometimes I just get so excited about a particular design and want to use it. I have one saved in my brain of flowers with watercolor effects using WebGL that I still haven’t found a good dataset for…
Alenka Where do you find inspiration?
Shirley Great question. I guess there’s finding inspiration for a specific project (and within that, inspiration for a topic and inspiration for the visuals) and just finding inspiration in general.
Through these three steps, I generally get there, at least in knowing what I want the visual to show or how to roughly visualize the data.
Alenka What are your future plans? Are you now moving in the direction of physical visualizations?
Shirley Yes! I’m going back to NYU ITP (where I did my artist residency and created my Fearless project, One Amongst Many) as a grad student this fall! Physical visualization is a part of what I want to explore, but definitely not all.
I think I’m currently fascinated with the idea of exploring different mediums, especially after eight years of making dataviz almost exclusively for the web. I’m curious about what I can do with that third dimension, or what I can do if we add other senses in, especially touch. And not just with our fingertips but with our whole bodies —I’m fascinated with this concept of how it feels for us/our bodies to be in the middle of a data experience. I’m excited by the thought of spending two years learning and exploring new things! And then afterward maybe going back to working full-time to keep honing/working on those skills?
Nadieh I actually attended Fab Academy between January and June to learn how to fabricate things with laser cutters, 3D printers, make my own electronics, etc., to be able to also (possibly) do physical visualizations. But we’ll see if I can ever get an actual project off the ground! For now, I’ve found myself suddenly pulled towards wanting to explore data and generative art more for a bit (looking a bit into NFTs and such).

My future plans in general never span more than about six months — I try to follow what I think is the most fun to me at that point (while still making an income along the side of course).
Lisa Wow. It feels like, in general, you’re moving quite fast through interests — in the most positive sense, because this way, you’re apparently learning a lot (physical data vis; generative art). It’s brave to get down a new path once you’re such an “expert” in another area, so kudos!
Nadieh Yeah, I’ve actually been thinking the same thing: “Should I move towards different fields than dataviz? In dataviz, I can get clients, get to be able to be a freelancer.” It’s not that I see myself moving away from dataviz though, at least, definitely not for a long time. I’m so new in the generative art scene, I feel like such a beginner there, getting to know people a bit, trying to converse in some Discords/Slack. I’m totally being intimidated by the amazing output from the people already well known there when comparing to my own. Dataviz “feels” safe for me, I think. So it’s kind of scary and exciting at the same time. No idea where it will lead though, I have no higher goal. If generative art or physical installations don’t work out, then that’s fine!
Lisa Maybe it’s a great idea, in general, to always feel like a beginner in at least one field.
Nadieh Good point! You don’t yet know what the “rules” are 😀 I sometimes think that I’m already too boxed-in with dataviz, that I now think too much in “chart types.” Whereas when I started and didn’t know, I just sketched stuff.
A big thanks to Nadieh and Shirley for attending our Data Vis Book Club discussion, answering all our questions, and allowing us to publish their answers on this blog! To read through the full discussion, head over to our notepad. And to keep updated about Nadieh and Shirley’s lives, follow them on Twitter (@NadiehBremer / @sxywu). By the way: We almost always invite authors to join our book club discussions. We’ll announce the next discussion on this blog and on Twitter (@datavisclub).


Comments