Radish to romanesco: A year in vegetables
February 20th, 2025
4 min
Datawrapper lets you show your data as beautiful charts, maps or tables with a few clicks. Find out more about all the available visualization types.
Our mission is to help everyone communicate with data - from newsrooms to global enterprises, non-profits or public service.
We want to enable everyone to create beautiful charts, maps, and tables. New to data visualization? Or do you have specific questions about us? You'll find all the answers here.
Data vis best practices, news, and examples
250+ articles that explain how to use Datawrapper
Answers to common questions
An exchange place for Datawrapper visualizations
Attend and watch how to use Datawrapper best
Learn about available positions on our team
Our latest small and big improvements
Build your integration with Datawrapper's API
Get in touch with us – we're happy to help
This article is brought to you by Datawrapper, a data visualization tool for creating charts, maps, and tables. Learn more.
Hi, this is Anna. At Datawrapper, I’m responsible for the basemaps you can find in our choropleth and symbol map editors. This Sunday is the vernal equinox, when day and night are equally long. This day marks the beginning of the astronomical spring — but is it really what we mean when we talk about spring? Let’s compare two different definitions, astronomical and meteorological!
There are many signs of the arrival of the spring: flowers start to blossom, blackbirds sing in the morning, migrating birds return to their summer grounds. This doesn’t happen at the same time everywhere, but depends on the local climate and the weather that year.
But one important sign of spring — the equinox — does happen on the same day for everyone. Observation of the equinoxes and solstices has been important in many cultures, throughout history and all over the world. For example, in the Babylonian calendar, spring starts at the first full moon after the March equinox. In the ancient Maya culture, a festival was held on this day to celebrate the beginning of the spring. These days mark the transition between different seasons.
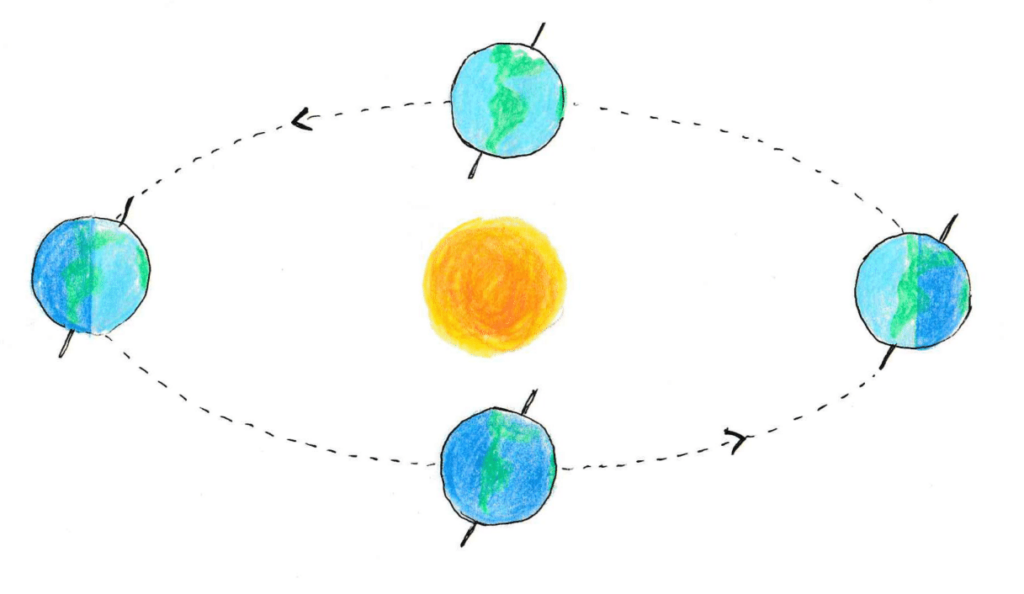
The length of the days varies over the year because of the 23-degree tilt in the Earth’s axis. During spring and summer the axis tilts towards the sun, which makes the days longer than in the fall and winter when the axis is tilting away from the sun. Our writer Rose explained the daylight changes in her weekly chart last November.

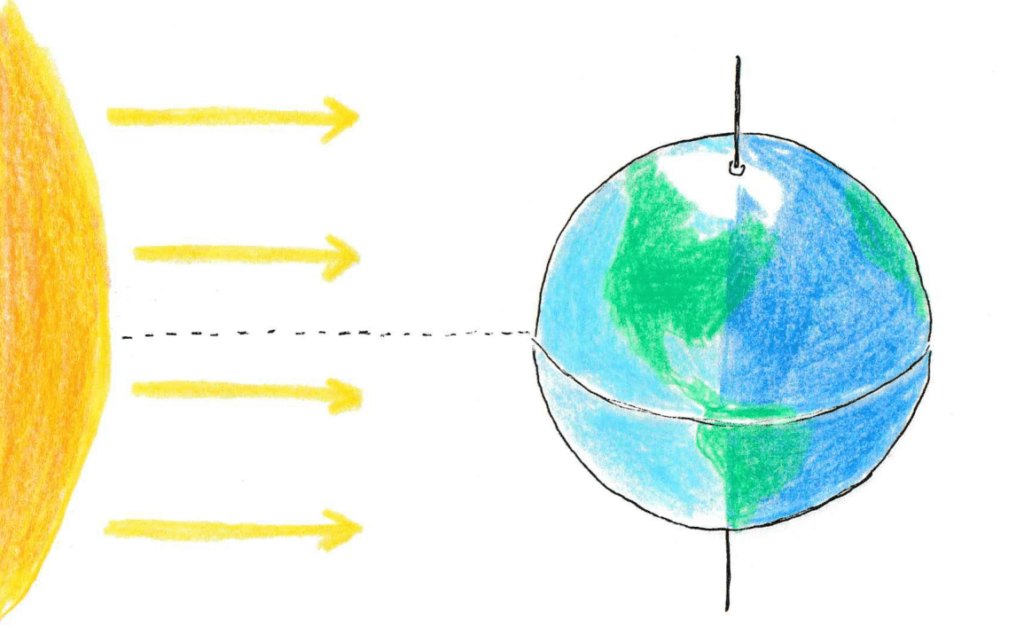
In the approximately[1] 365 days it takes for the Earth to circle around the sun, it passes four extreme locations in its orbit: the autumnal and vernal equinoxes, and the summer and winter solstices. On the equinoxes, the equatorial planes of the sun and the Earth align, the surface of the Earth is illuminated by the sun equally from pole to pole, and day and night are equally long all over the world.

According to the astronomical definition, spring arrives on the same day everywhere in the Northern Hemisphere — but that doesn’t always match what we can see in nature. In Sweden for example, it might still be knee-deep snow in the north while the first flowers blossom in the south.
The Swedish Meteorological and Hydrological Institute, SMHI, has an alternative definition that describes when the spring has arrived to a certain location. It says that spring is here when the average temperature is above zero degrees for seven days in a row. By this definition, the spring can come as early as February 15 in Falsterbo and as late as May 9 in Abisko.
This map of Sweden shows the country divided into zones based on what day meteorological spring usually arrives. In one zone, which includes Stockholm, the meteorological and astronomical springs come at almost exactly the same time. But regardless of its definition, spring is always very welcome!
That’s it for me this week. I hope you enjoyed this Weekly Chart and will enjoy the spring too!
Comments