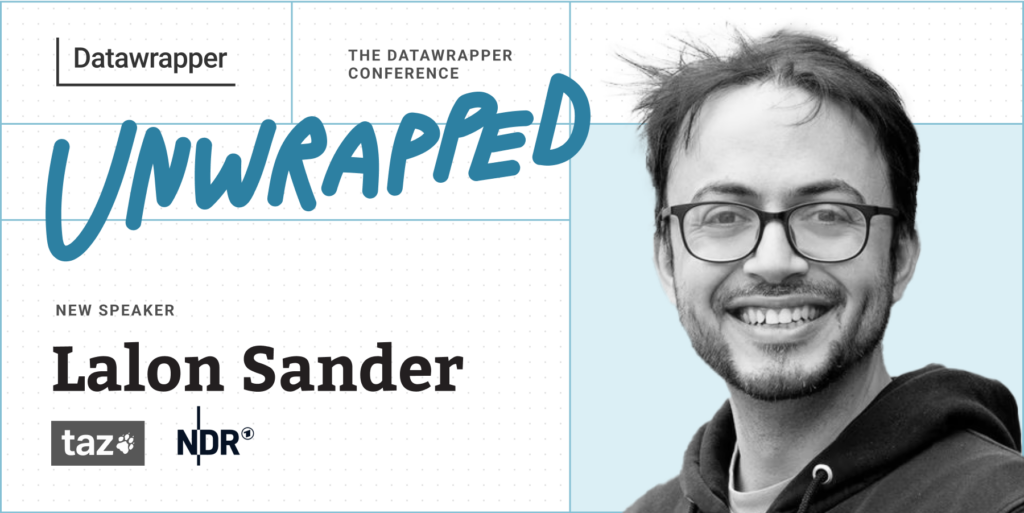
Lalon Sander, taz/NDR, will speak about automating HTML buttons to link multiple charts

We’re excited to announce that Lalon Sander from taz/NDR will speak at our Unwrapped conference about “How we automated HTML buttons to link multiple charts.”
Lalon is a data journalist for the German daily taz and the public broadcaster Norddeutscher Rundfunk (NDR). He analyzes data about climate change, enjoys automating processes and building data pipelines.
Time to ask him some questions:
Lalon, what will you talk about?
Datawrapper offers a clever workaround to link multiple charts by adding HTML links to the chart descriptions. However, the process is repetitive and a little tedious – if you’re linking five charts, you have to write and modify code for 25 buttons. Using Python and Streamlit, we built a tool with which we can link any number of charts together, while ensuring a standardized look over all our articles and conforming to our corporate color schemes.
Why/how did you start using Datawrapper?
The taz had a Datawrapper account quite early on (2016, if not earlier), which we used to migrate our charts away from Google Charts, which had served our purposes well till then. Datawrapper didn't have a map function at the time and was often very cumbersome. It's exciting to see how Datawrapper has added numerous features over the past years and has now become the industry standard for data journalists.
What has changed since you started using Datawrapper?
The biggest change for me has been the ability to create and update Datawrapper charts via API. This has made it effortless to create dashboards that update their data daily, as well as to create many similar charts from one data source.
The linking tool I am presenting has made our everyday work extremely easy and would be unthinkable without an API. In my day-to-day work, charts created completely by hand are now the exception rather than the rule.
We're looking forward to Lalon's talk at Unwrapped! Until then, you can find more about him on X, Mastodon, and Bluesky. To sign up for Unwrapped and hear Lalon and other great speakers, visit our conference website.


Comments