

New: Stay organized with a more powerful, faster visualization archive
June 25th, 2024
3 min
This article is brought to you by Datawrapper, a data visualization tool for creating charts, maps, and tables. Learn more.
You can now embed Datawrapper visualizations using Web Components, significantly increasing the performance on pages with many embedded visualizations.
Up to now, you’ve had two ways to embed Datawrapper visualizations on other websites: responsive and normal iframes. While iframes have served us well for the past ten years, they also come with considerable downsides, which is why today, we’re introducing a new way to embed visualizations without iframes.
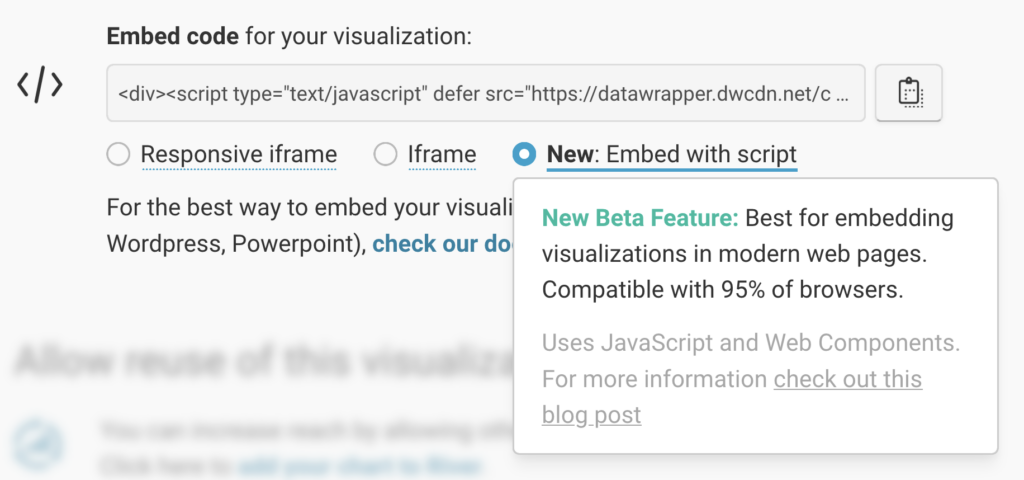
The new “script embed” option uses the Web Components standard, allowing us to insert Datawrapper visualizations directly into our users’ websites using a custom element called <datawrapper-visualization>.
The HTML markup and styles for the embedded visualization are encapsulated within the web component (using a technology called Shadow DOM), so the styles won’t affect the embedding website.
For this to work, your CMS needs to support inserting JavaScript tags. This is how a typical script embed code looks:
<div>
   <script type="text/javascript" defer
        src="https://datawrapper.dwcdn.net/b3TBj/embed.js?v=14">
   </script>
   <noscript>
      <img src="https://datawrapper.dwcdn.net/b3TBj/full.png" alt="[aria-description]" />
   </noscript>
</div>
As you see, for maximum compatibility, the embed code includes an image fallback in case the page is opened in a browser without JavaScript enabled. If you’re curious to see what script embeds look like under the hood, inspect the table embedded further down in this blog post.
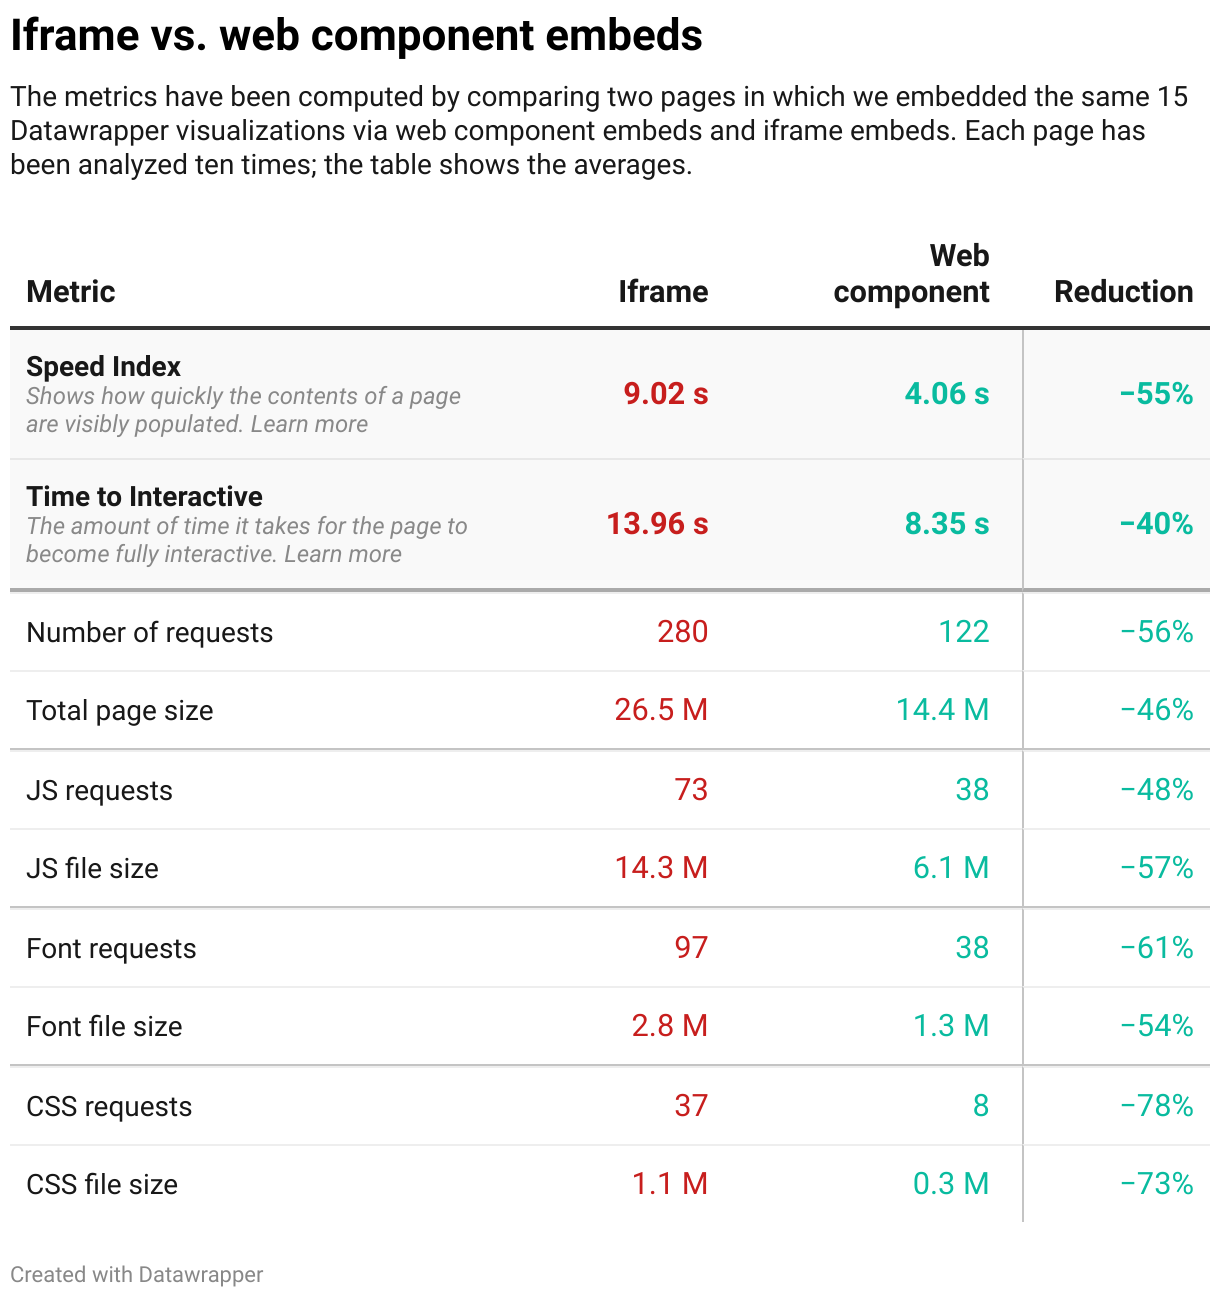
The main problem with iframes is that, for security reasons, they are not allowed to share resources. If you embed two line charts on your site, they both load and parse the same visualization render code, theme stylesheets, and web fonts. On top of that, modern web browsers treat iframes as separate browser tabs displayed within a website. Visiting one page with ten iframes consumes almost the same resources as opening 11 browser tabs at once.
We ran a performance test for a sample website with 15 Datawrapper visualizations embedded, and as you see, the results are much better when using web components (here’s the iframe version for comparison). It takes about half as much time to build and render the page and, thanks to shared resources, the number of requests has also dropped by half.
There are other issues with iframes as well. Since they are encapsulated within a box, it’s harder to integrate iframes into the embedding website. The iframe height has to be adjusted manually as the content of the iframe changes (which is exactly what our responsive iframe embed does).
Tooltips are another shortcoming: They can’t leave the iframe, even on mobile devices when it would make much more sense to stick them to the bottom of the display. And sometimes, a user can get locked within an iframe when scrolling down a page.
Yes, absolutely. There are no plans to remove the iframe embed option, so the new script embeds are entirely optional. You can safely try them out whenever it’s convenient. In the long run, however, we think the new script embed is probably going to become the default embed option.
We recommend you create an unlisted test page on your website to try out the new embed before using it on production. As explained above, one requirement is that your CMS allow you to insert custom JavaScript tags. But chances are good that if you used our responsive iframe embeds before, the new script embeds will also work for you.
If you use our self-hosting feature to publish your visualizations on a custom domain, you need to ensure it supports CORS requests from the website in which you are embedding visualizations.
With iframe embeds, you could set certain render flags via query parameters, such as ?dark=1. With the new script embed, you can do the same by setting the flags as data attributes to the script tag:
<script
    type="text/javascript" defer
    src="https://datawrapper.dwcdn.net/s7YQ5/embed.js?v=1"
    data-dark="true" data-logo="on">
</script>Browser support for the Web Components standard is over 95%. All major browsers support it. If a browser without web component support encounters your visualization, the embed will fall back to an iframe. If it is rendered in a browser with JavaScript disabled, it will fall back to a static PNG image of the visualization.
We took great precautions so that this won’t happen. Our visualization code doesn’t load or inject external dependencies into the global scope of the website it’s embedded in. The embed will only add a global datawrapper object to the window scope, which is used for sharing resources.
The visualization code also doesn’t make any DOM changes, with one exception: custom elements can’t define their own web fonts, so we have to inject these fonts into the embedding page (but we’ll only do so if the font is not already loaded).
<a target=“_self”>In visualizations embedded as an iframe, you could link to other visualizations that open within the same iframe using a trick we explained in our Academy here. The good news is that this will also work without iframes. Our embed script will detect these links and load a different visualization into the same spot when they are clicked.
Yes, but you need to re-publish the visualization if it has been last published before March 3rd, 2023. You can see when the visualization was published last by clicking on it in the Archive. In general, if you’re embedding multiple visualizations on the same page, we recommend you publish the visualizations around the same time.
We hope you’ll find the new embed method helpful 🎉! And as always, please contact our Support team if you have more questions about the new Web Component script embedding or if you discover something that’s not working as expected.
Comments