

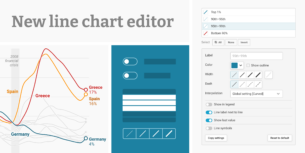
New: Stay organized with a more powerful, faster visualization archive
June 25th, 2024
3 min
This article is brought to you by Datawrapper, a data visualization tool for creating charts, maps, and tables. Learn more.
The 2018 FIFA World Cup is happening, and will continue to do so until the 15th of July. Our Twitter timelines are full of emotions and analyses. And since the Datawrapper office is based in one of the biggest football nations on this planet (Germany), we haven’t ignored this event and created three charts. You can find all of them in the Datawrapper River, so you can use them in your own articles for free.
First, a table with the up-to-date results from each match in the group stage. You can sort by date, teams and (most useful), by groups:
To create this table, we used two recent Datawrapper features:
Here is another table with our new flag icons; just a little reminder which team plays in which group:
And in case you were wondering how fair the distribution of teams is in their groups, we created a scatterplot that shows how all these teams are ranked by the Elo system. Hover over the dots to find out how these teams are ranked by FIFA, too:
Have you made your own chart or map about the World Cup? Add it to the River, let Lisa know about it at lisa@datawrapper.de, and we’ll make sure to feature your chart in this article.
Good luck to your team, and happy football-watching!
Comments