

Investopedia: “Datawrapper is taking our content to the next level”
April 6th, 2022
6 min
This article is brought to you by Datawrapper, a data visualization tool for creating charts, maps, and tables. Learn more.
One day in fall 2019, independent data visualization specialist Cédric Scherer was browsing social media when he came across the “#30DayMapChallenge,” then a new project about to happen for the first time. Cédric decided to participate and created 28 maps in 30 days — some of which, he says, “are still among my favorite personal visualizations.”
At the end of the #30DayMapChallenge in November 2020, climate scientist Dominic Royé suggested creating an equivalent for charts — a “#30DayChartChallenge” — and asked Cédric to collaborate. Cédric was in. The two of them organized the first #30DayChartChallenge in April 2021. Like for the map challenge, Dominic and Cédric decided on themes for all 30 days (like weather, part-to-whole, neo, trend, historical, good/bad). Anyone who wanted could use them as a starting point and share their chart on social media using the #30DayChartChallenge tag.
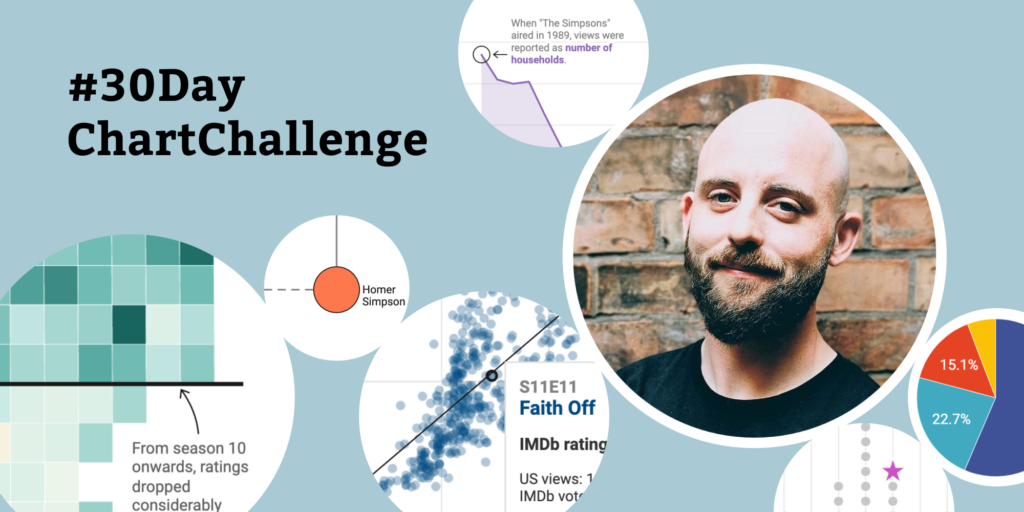
This April 2024, the #30DayChartChallenge took place for its fourth year in a row. And this year, Cédric set himself two special meta challenges: to create only charts about The Simpsons (most often with this data set), and to complete the challenge using only Datawrapper.
Here we ask Cédric about his experiences along the way and show some of his results:
I opted to use Datawrapper for this year’s #30DayChartChallenge for two main reasons: practice and efficiency. Having used Datawrapper before, I aimed to delve deeper into its various chart types and experiment with different styling options. At the same time, I hoped it would reduce my efforts thanks to its great default theme and functionality.
From waffle charts and family trees with scatter plots to heatmaps with choropleth maps, it was fun to explore options to push Datawrapper beyond its regular charting offerings. I've also picked up several tricks for customizing labels and creating visually appealing tooltips.
While using Datawrapper, I've occasionally missed the flexibility of ggplot2, particularly when it comes to mixing chart types and quickly iterating through variables. The ggplot2 framework excels at creating automated and reproducible visualizations with extensive customization options. Datawrapper, on the other hand, offers excellent default settings and simplifies the chart creation process. Its ability to quickly generate interactive and responsive charts makes it a compelling choice for future projects.
I'd say there's more than one guiding principle for me when creating data visualizations, but probably the most important one is: Think about the purpose and main message of the visualization. Too often, charts are created without a clear narrative and audience in mind. Without a clear roadmap, it becomes difficult to work towards creating the "best" visual representation of the data for the target audience.
Challenge your habits! Instead of defaulting to the same chart type out of habit, explore different ways to visualize your data. If you feel limited by one tool, don't hesitate to try others. Even if the attempt doesn't yield the desired result, it's a valuable learning opportunity. Best case, you gain a fresh perspective on how to effectively visualize your data and communicate your message.
I'd say the annotation functionality, not only because callouts are a crucial element of good data visualizations, but also because it applies to (almost) all chart types.
It's an impressively powerful yet simple to use feature in Datawrapper. Plus, I love the way annotations collapse into footnotes, adding a neat touch. I often find myself raving about this feature whenever I introduce others to Datawrapper.
Thanks for answering these questions, Cédric! You can find all of Cédric's #30DayChartChallenge visualizations in this blog post. To learn more about him, visit his website, or find him on X, Bluesky, or LinkedIn.


Comments