We want to enable everyone to create beautiful charts, maps, and tables. New to data visualization? Or do you have specific questions about us? You'll find all the answers here.
The best of last week’s big and small data visualizations
Lisa Charlotte Muth
Welcome back to the 140th edition of Data Vis Dispatch! Every week, we publish a collection of the best small and large data visualizations we find, especially from news organizations — to celebrate data journalism, data visualization, simple charts, elaborate maps, and their creators.
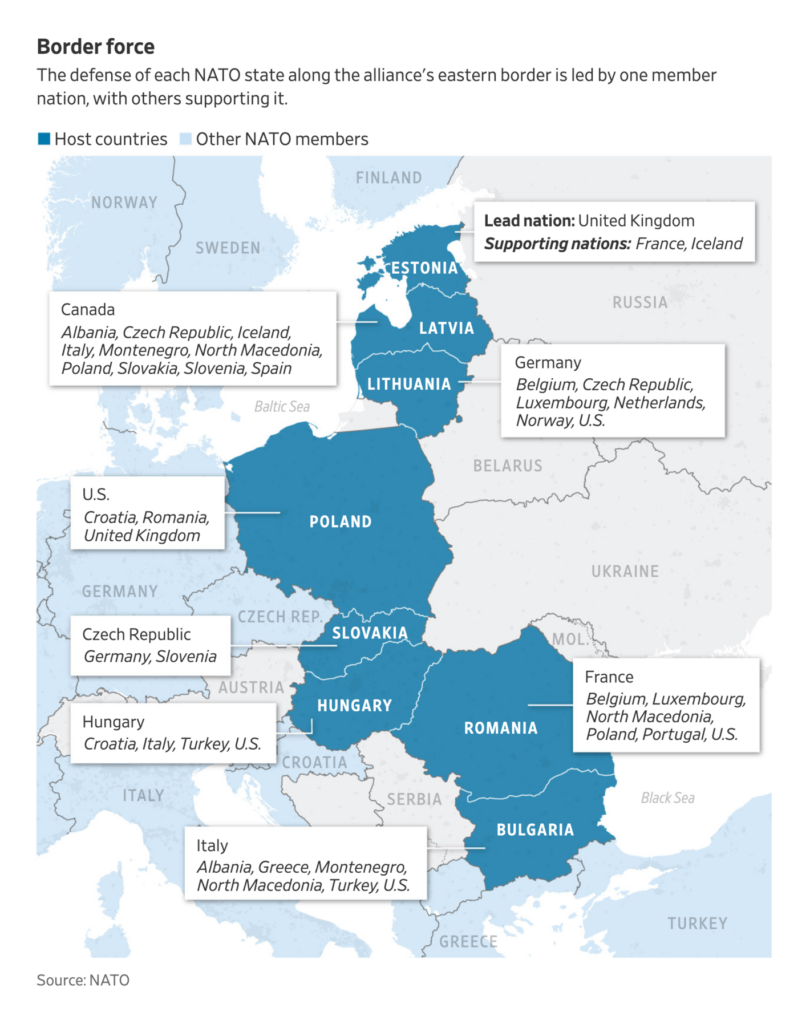
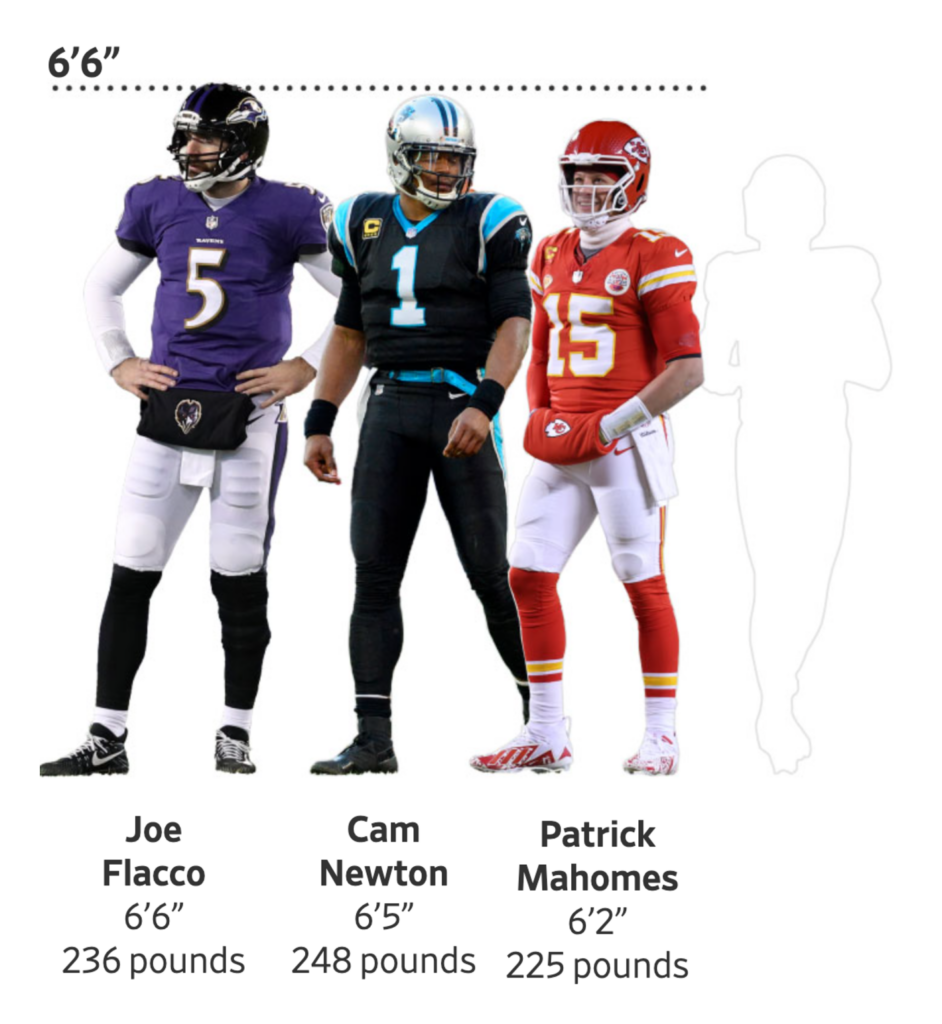
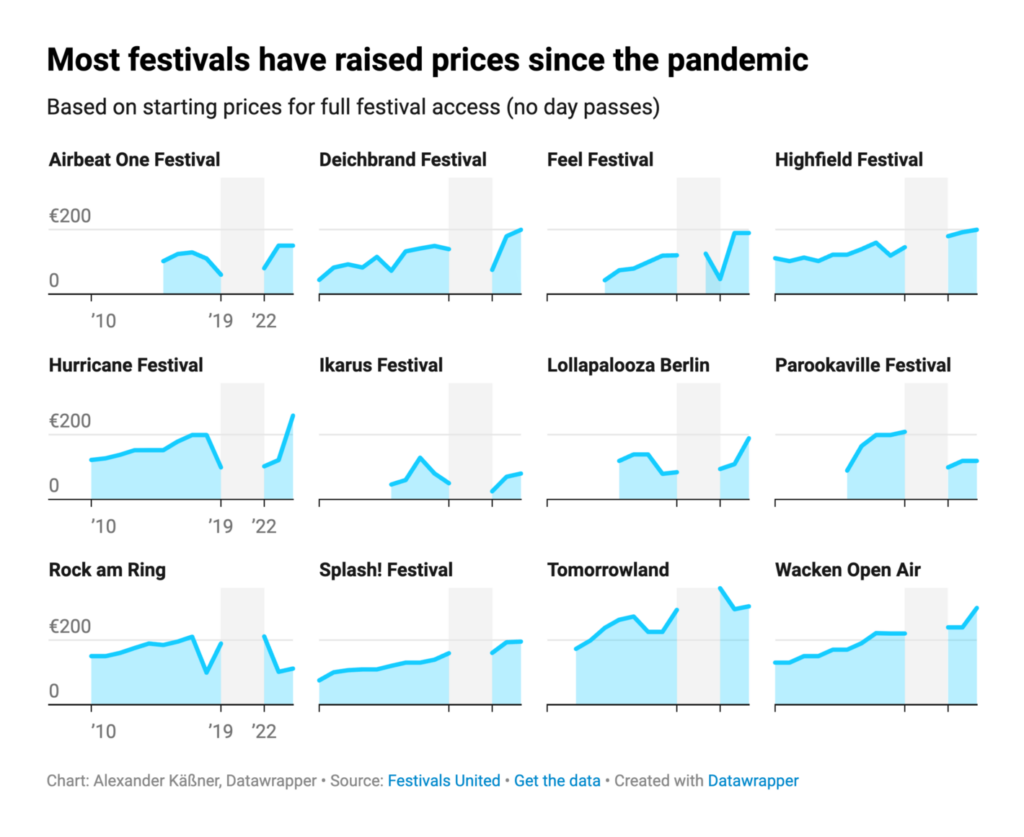
Recurring topics this week include student protests, elections, borders, and things we do in our free time.
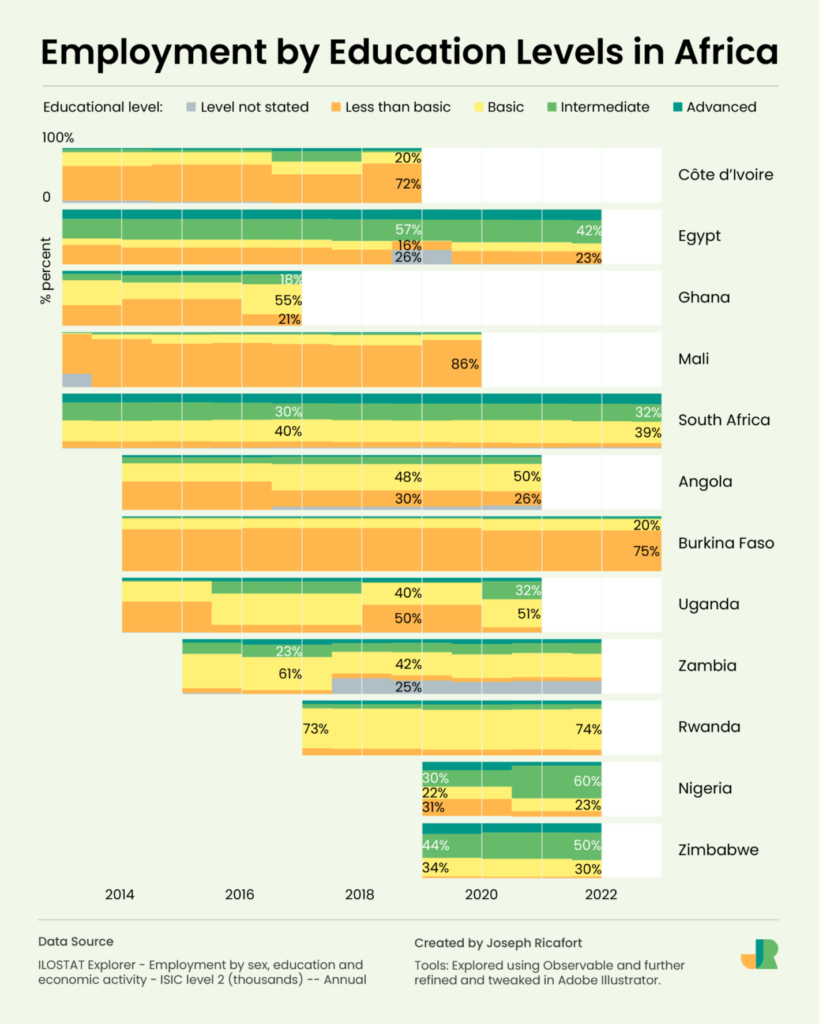
A great #30DayChartChallenge is coming to an end. Here’s what we liked from the fourth week of the challenge:
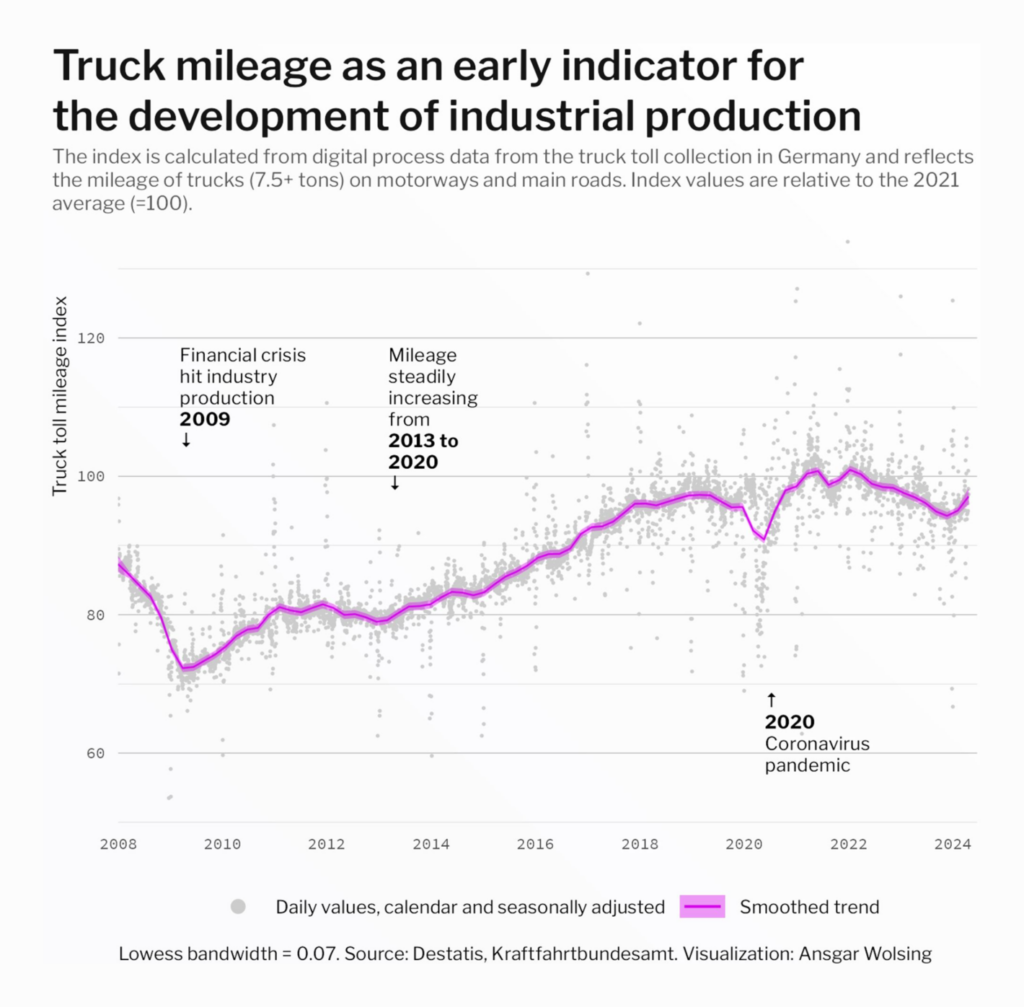
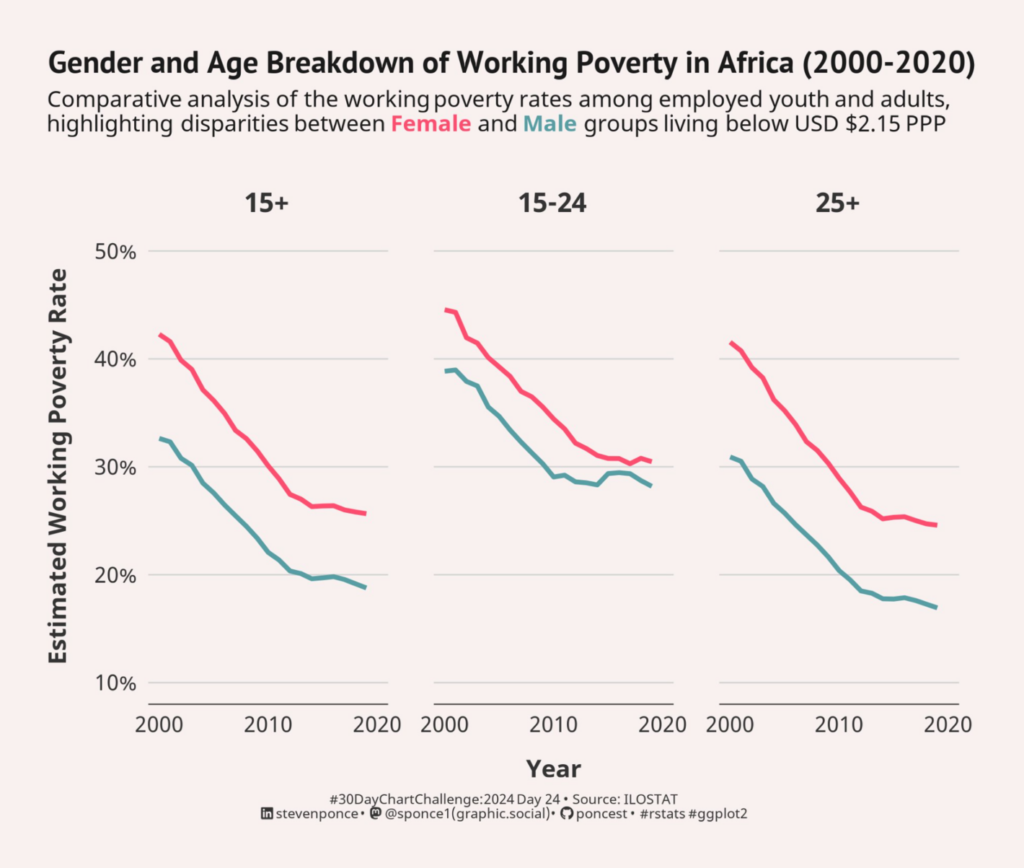
Nadya Andrianova: “Day 14 of #30daychartchallenge. Heatmap. Each rhombus shows number of people living in countries with different air quality levels. To show pollution level I used masks that still have since covid. More layers of fabric — lower air quality. Again you need light to see my viz 🌞,” April 28 (Tweet)Joseph Ricafort: “Day 24: ILO Region for Africa (Data day) of #30DayChartChallenge. One of the challenges of working with a #dataset is the lack of consistency. Here’s a stepped area chart (including some abrupt changes in values) of #employment by #education levels across African countries,” April 27 (Tweet)Ansgar Wolsing: “Truck mileage as an early indicator for the development of industrial production in Germany. 🚛 #30DayChartChallenge | #Day28 | Trend #rstats 📊 #ggplot2,” April 28 (Bluesky)Steven Ponce: “2024 #30DayChartChallenge | day 24 | timeseries | ILO Africa Region (data day). The data comes from the ILO Africa region. This #viz compares the estimated working poverty rates by gender and age groups. 📂: github.com/poncest/30DayC… #rstats | #dataviz | #rstats | #ggplot2,” April 24 (Tweet)
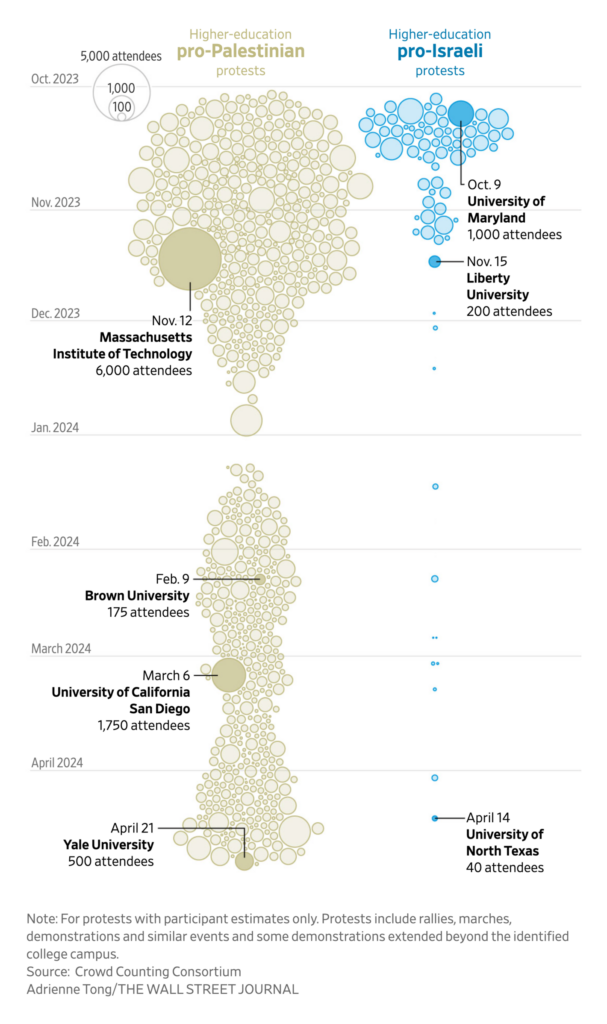
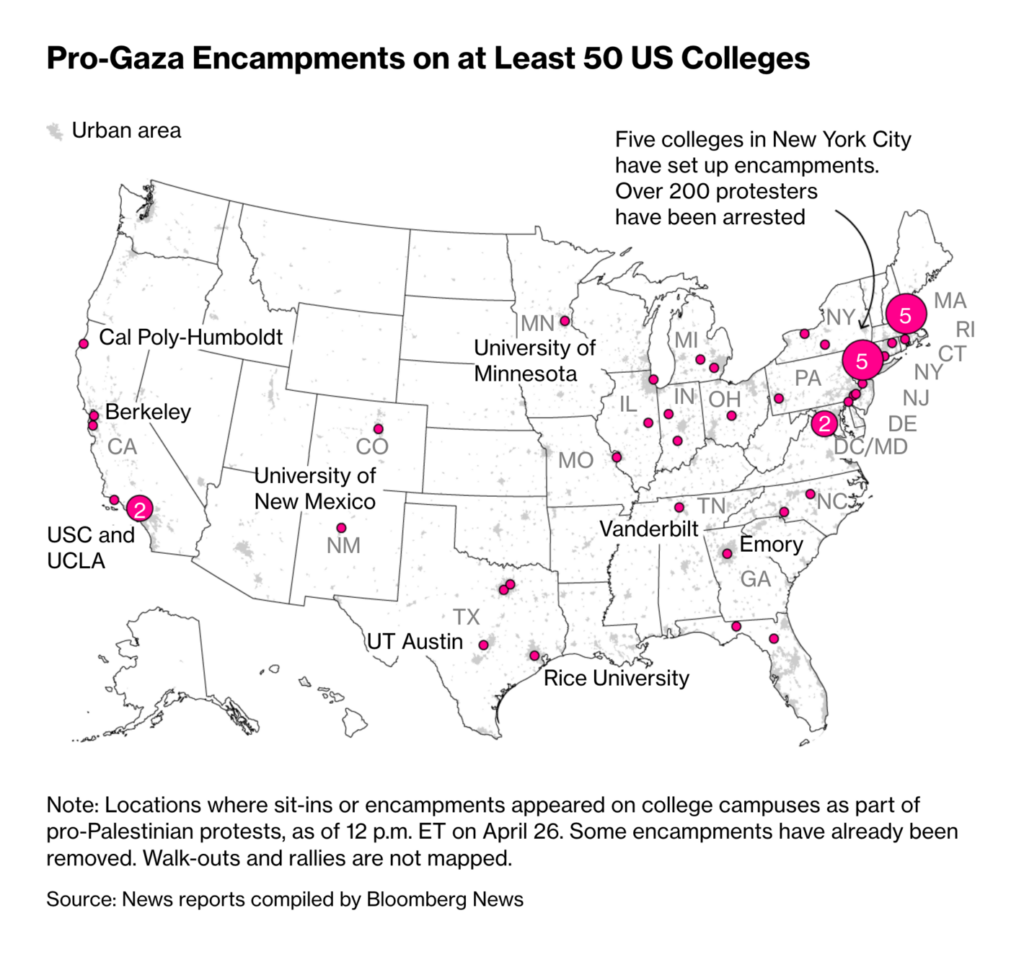
Thousands of students have participated in pro-Palestinian protests at several U.S. colleges, leading to controversial arrests this week:
The cause of the protests — the war in Gaza — continues to be mapped. This week, the New York Times discussed a temporary pier being built to facilitate the delivery of humanitarian aid:
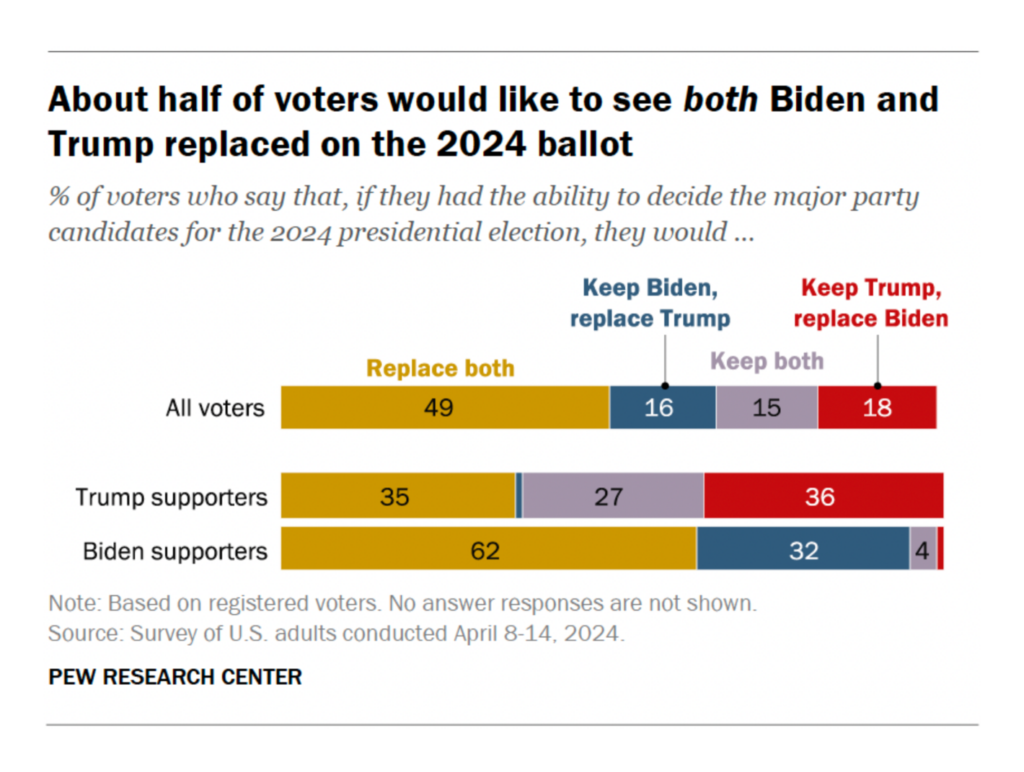
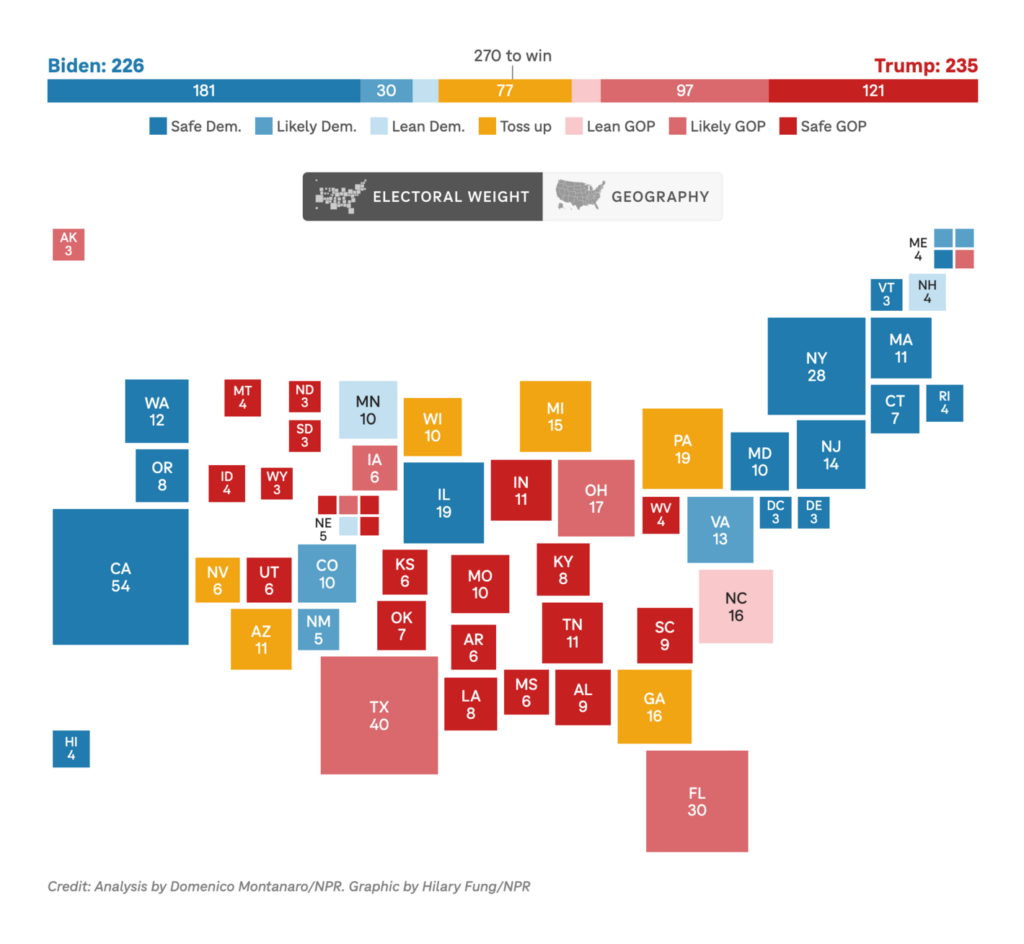
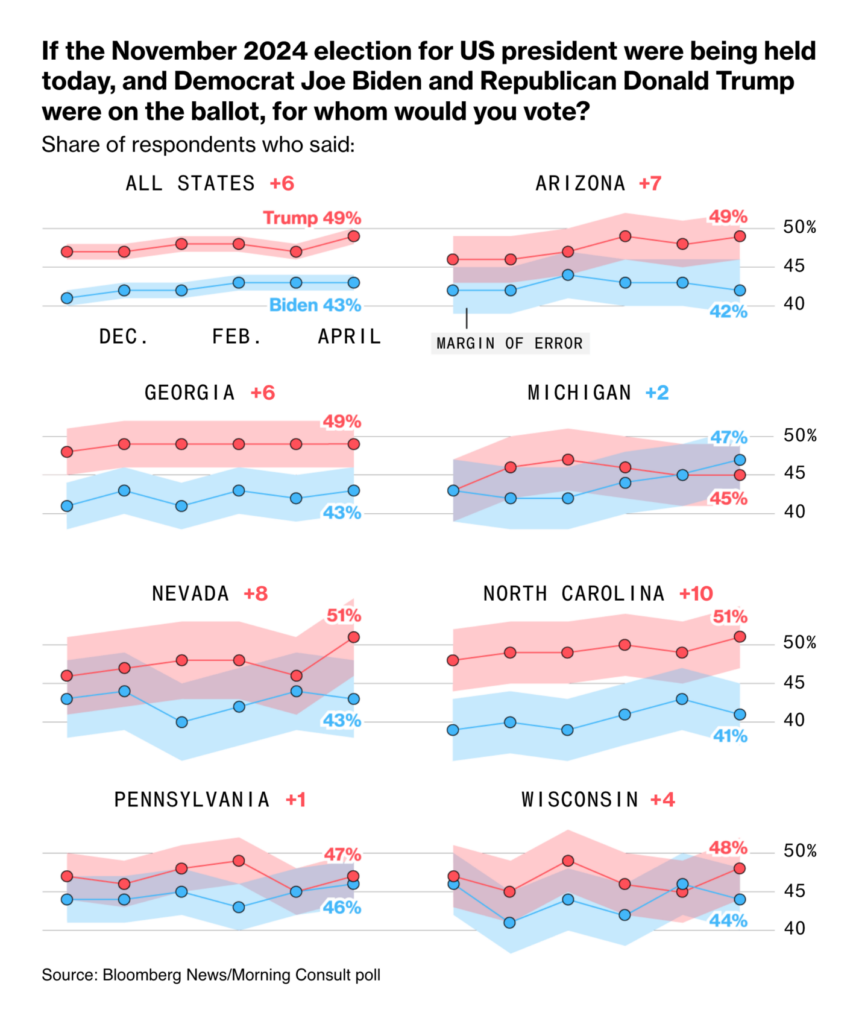
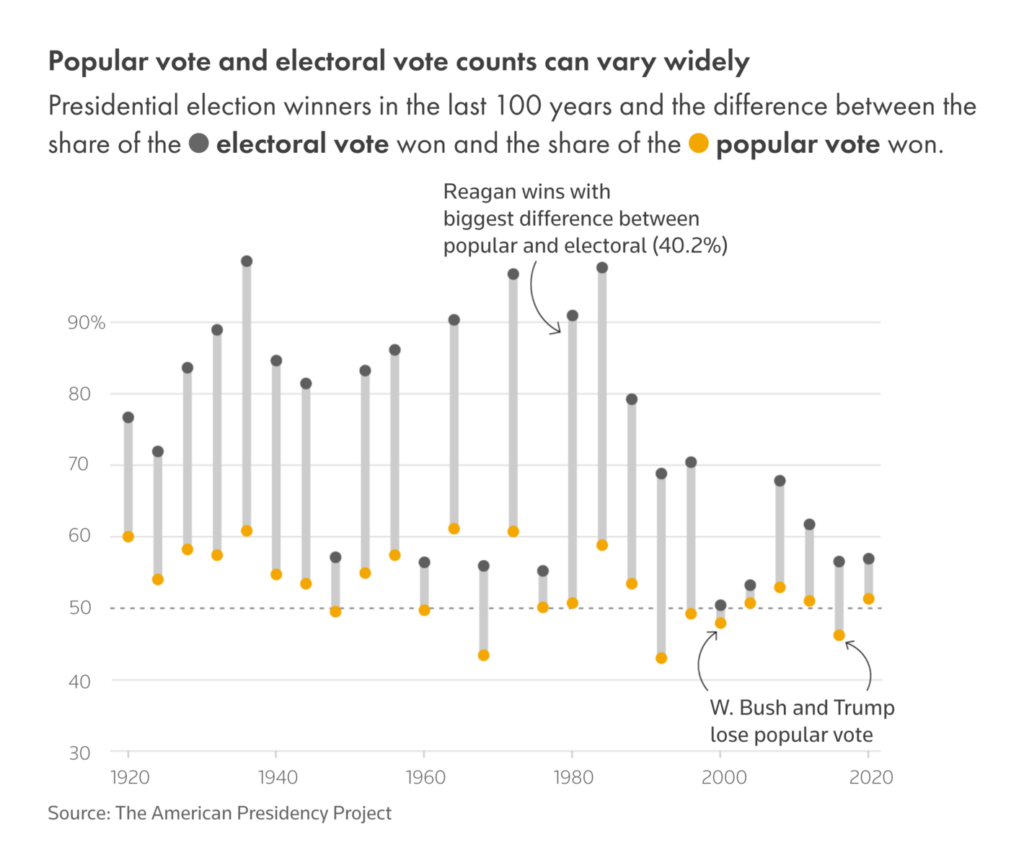
As you probably know, it’s election year… everywhere. Many newsrooms have already published U.S. election poll trackers and forecasts (The Economist, The Hill, The New York Times, The Wall Street Journal, and others). Reuters warns us that there’s often little to read into them:
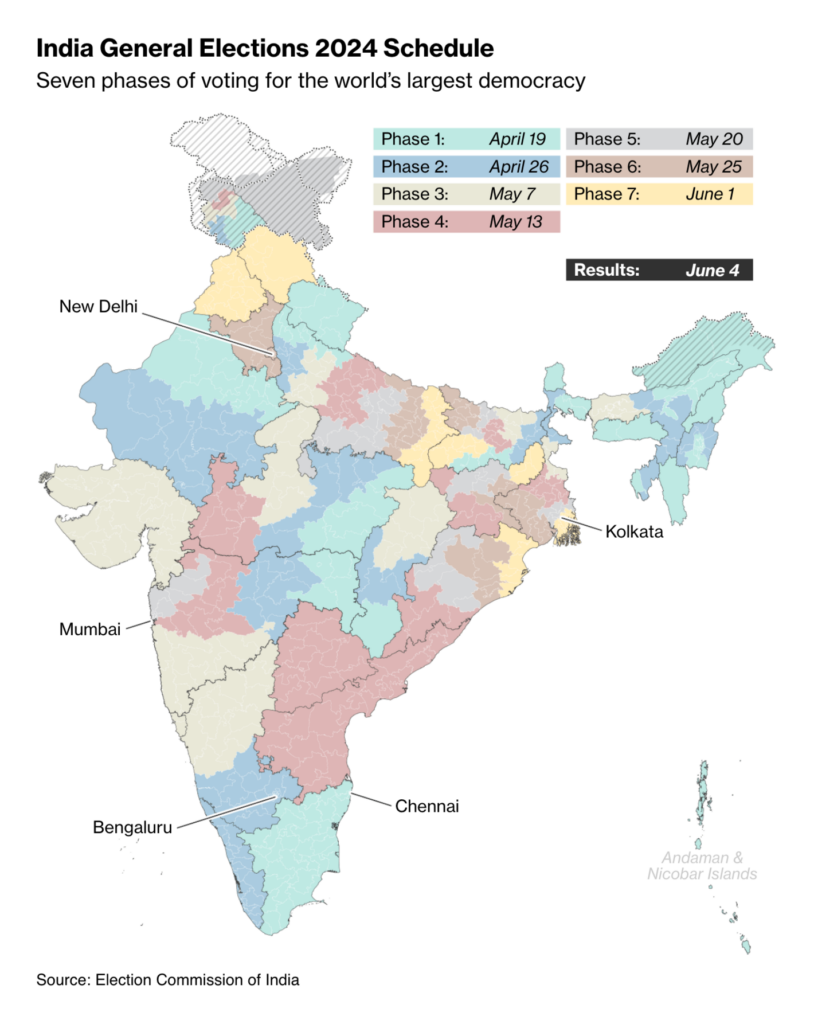
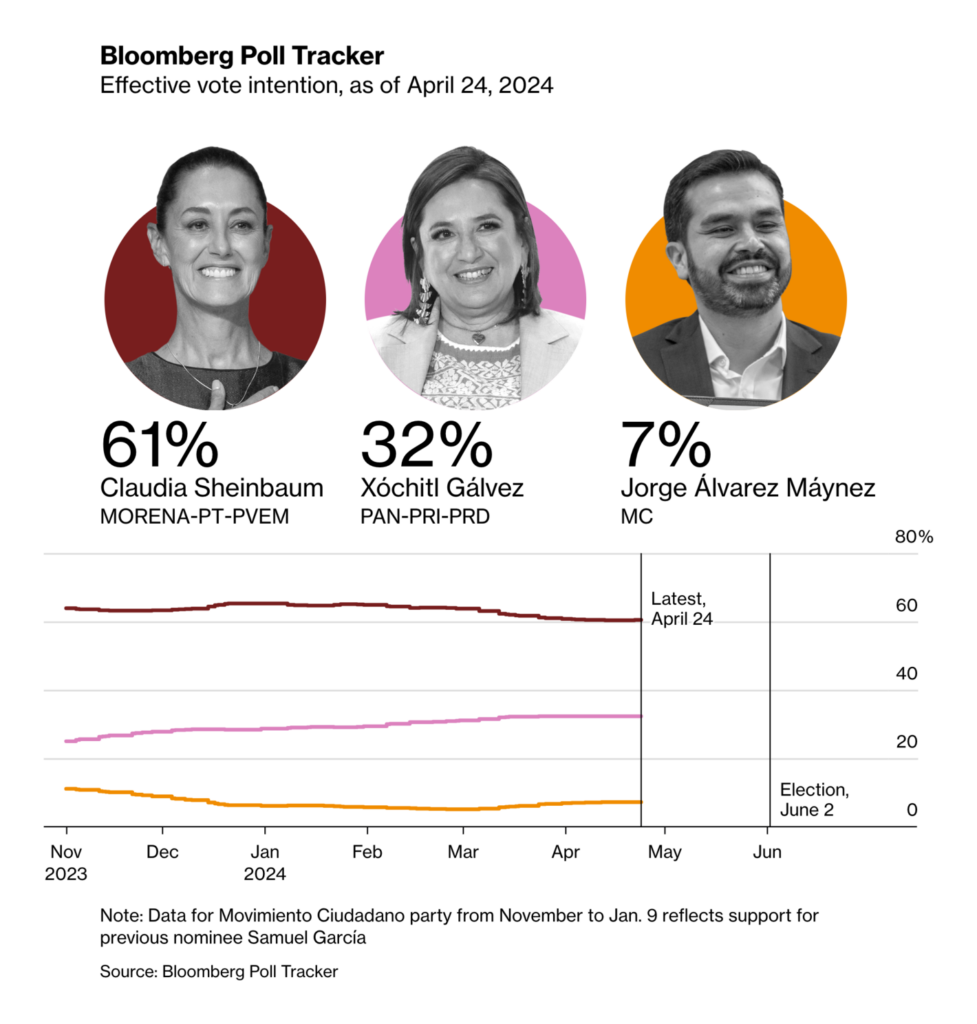
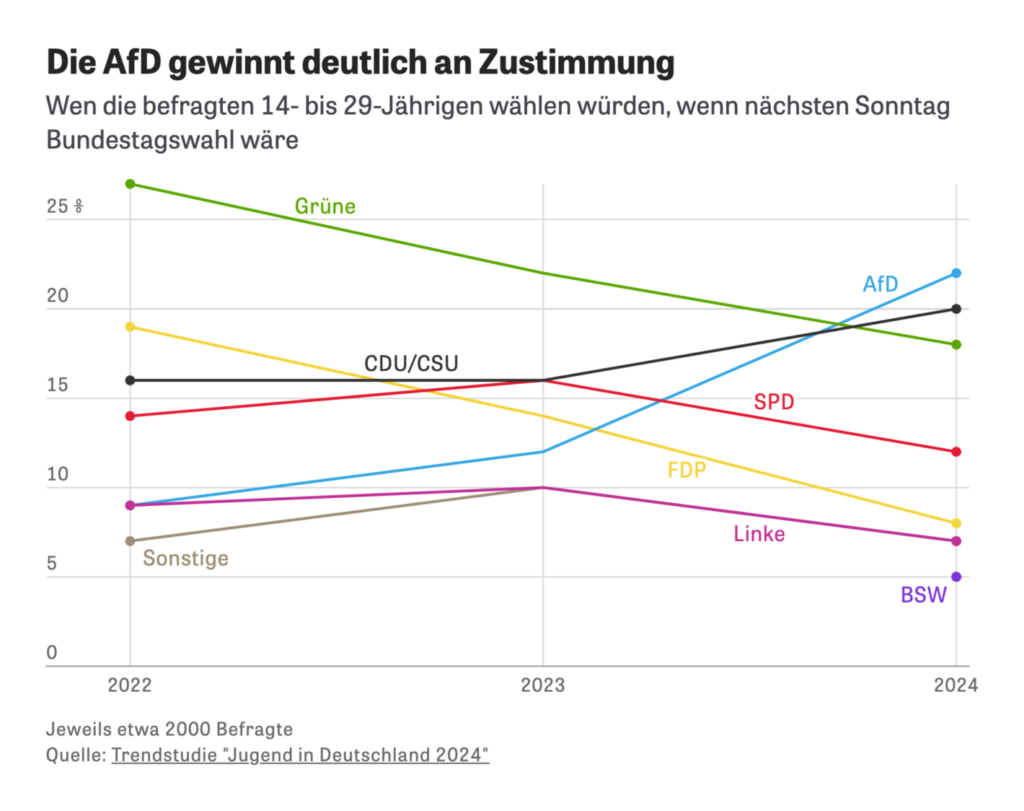
And continuing with elections, here’s India (now the world’s most populous country!), Mexico, and some concerning polls from Germany:
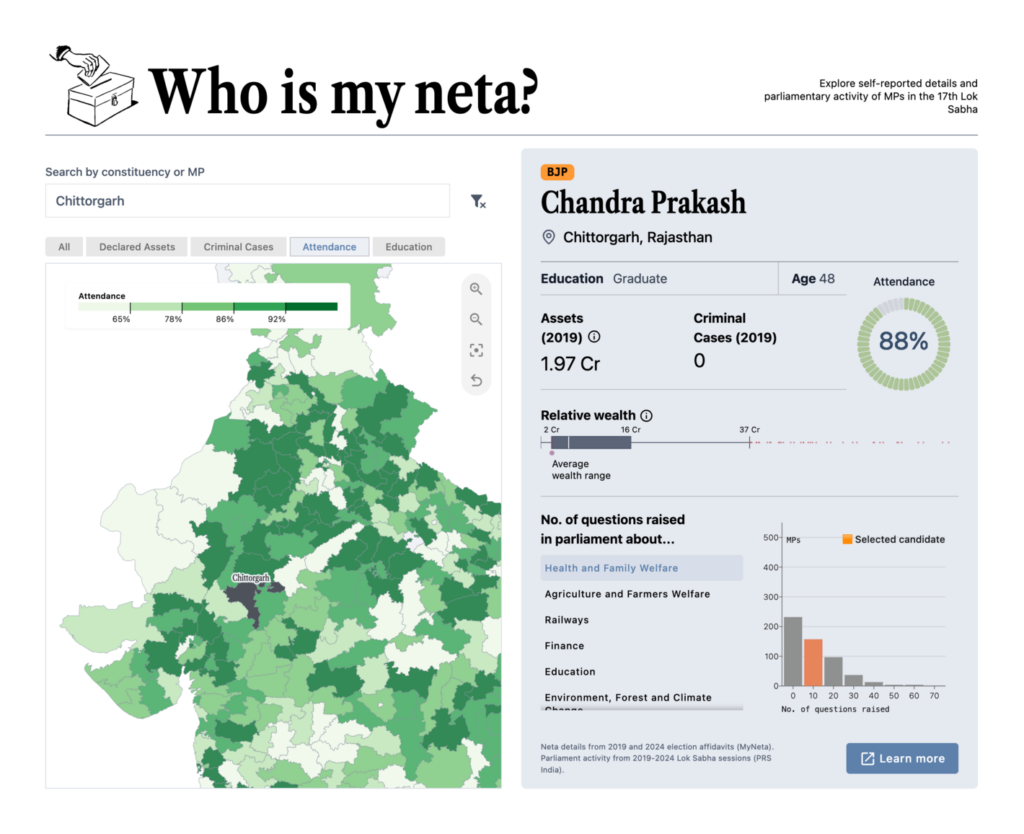
Bloomberg: Mangaluru to Test Development Versus Hindutva Split: India Votes, April 25Aman Bhargava: “New mini project! We’ve built a small explorer to visualize self-reported election affidavits from 2019 (and 2024 where available) and each MP’s parliamentary activity. Go have a look for your own constituencies. More data coming in future updates,” April 25 (Tweet, Website)Our World in Data: “China is no longer the most populated country in the world. According to estimates by the UN World Population Prospects, India took over in 2023. That year, both countries had around 1.4 billion inhabitants — as many as the entire African continent,” April 26 (Instagram)Bloomberg: Mexico Election 2024: Polling Tracker, April 26Zeit Online: Der rechte Vibe verfängt, April 23
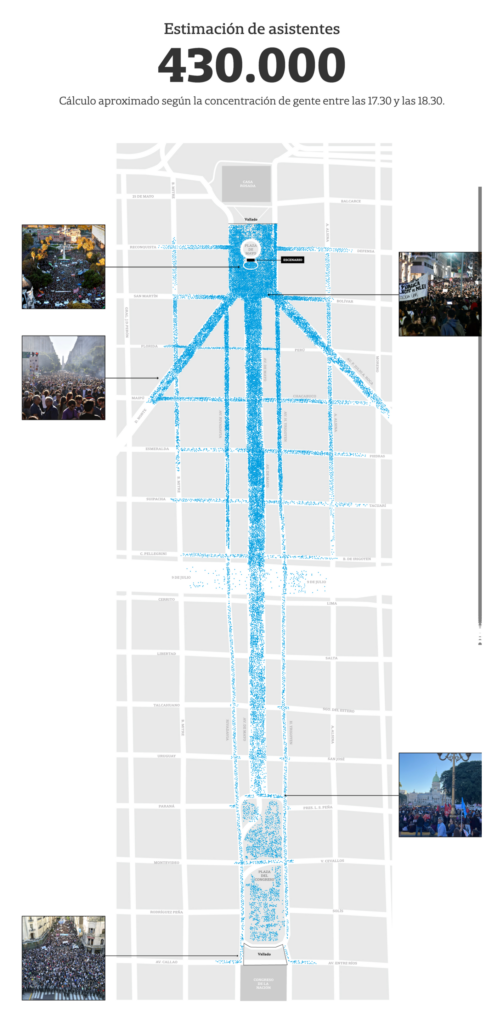
As for politicians already in power, people could be happier with them. In Argentina, 430,000 people took to the streets of Buenos Aires alone to protest in defense of public universities:
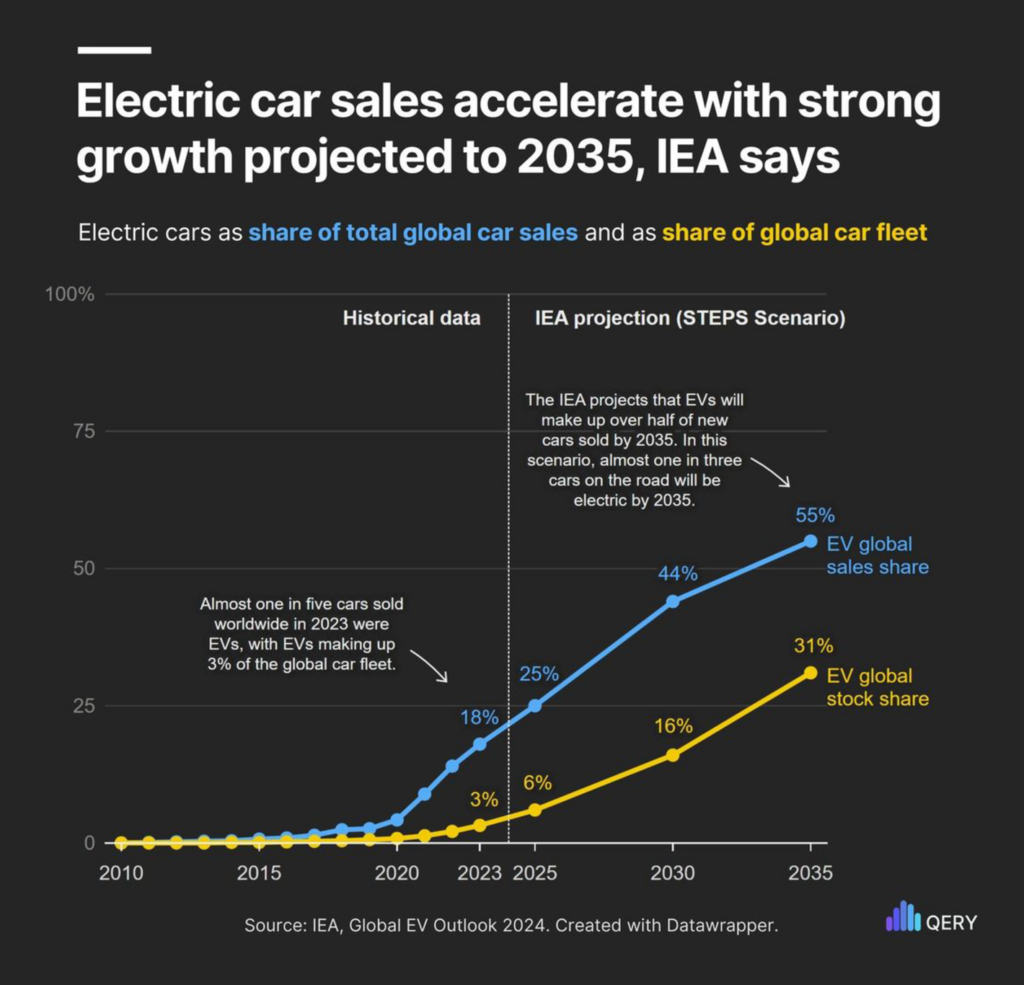
The solution to some of these problems? Clean(er) energy and electric cars.
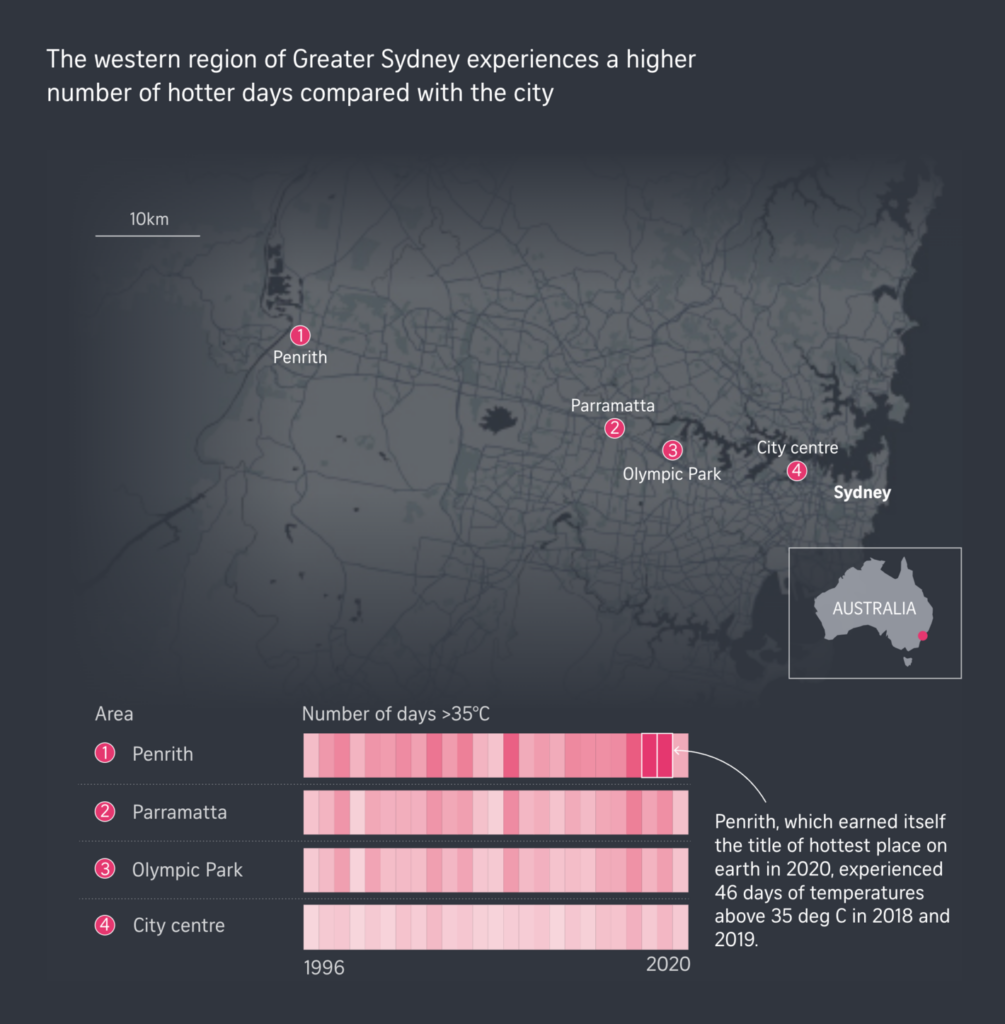
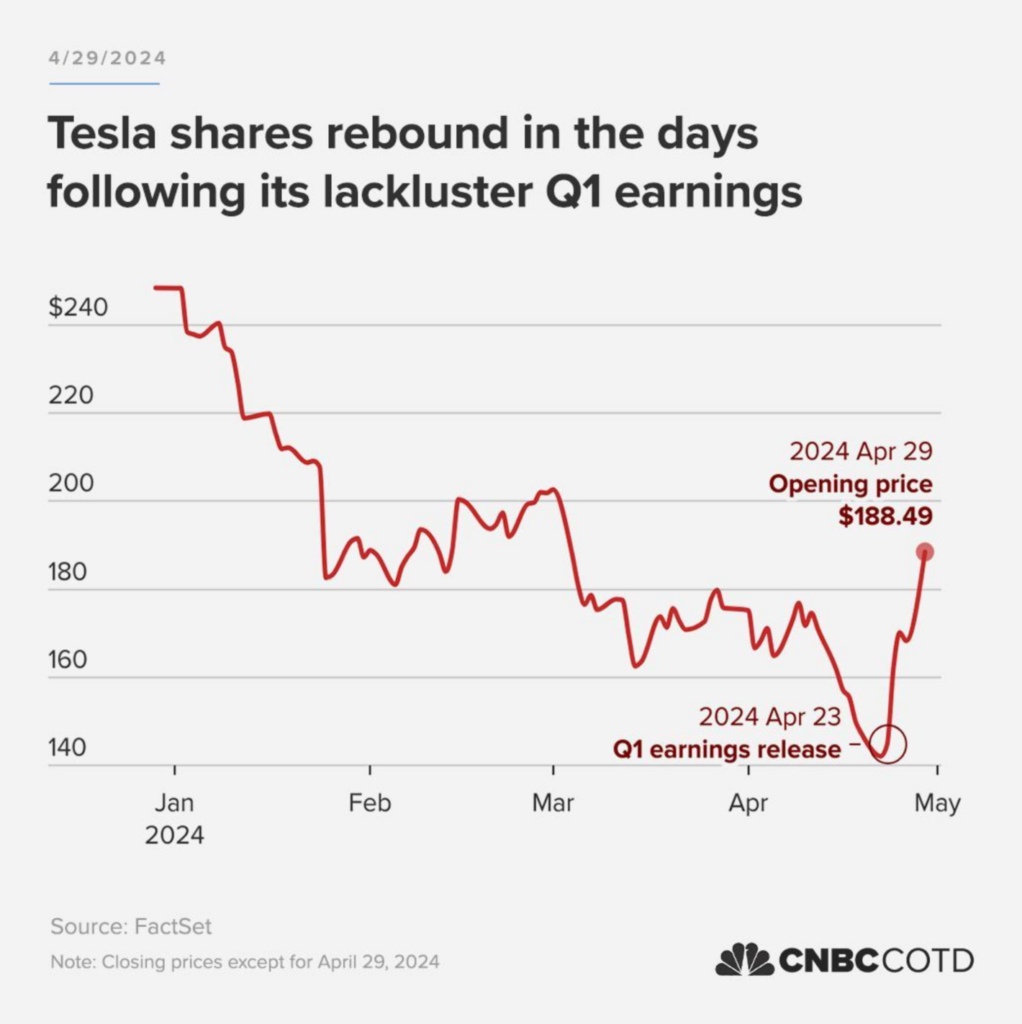
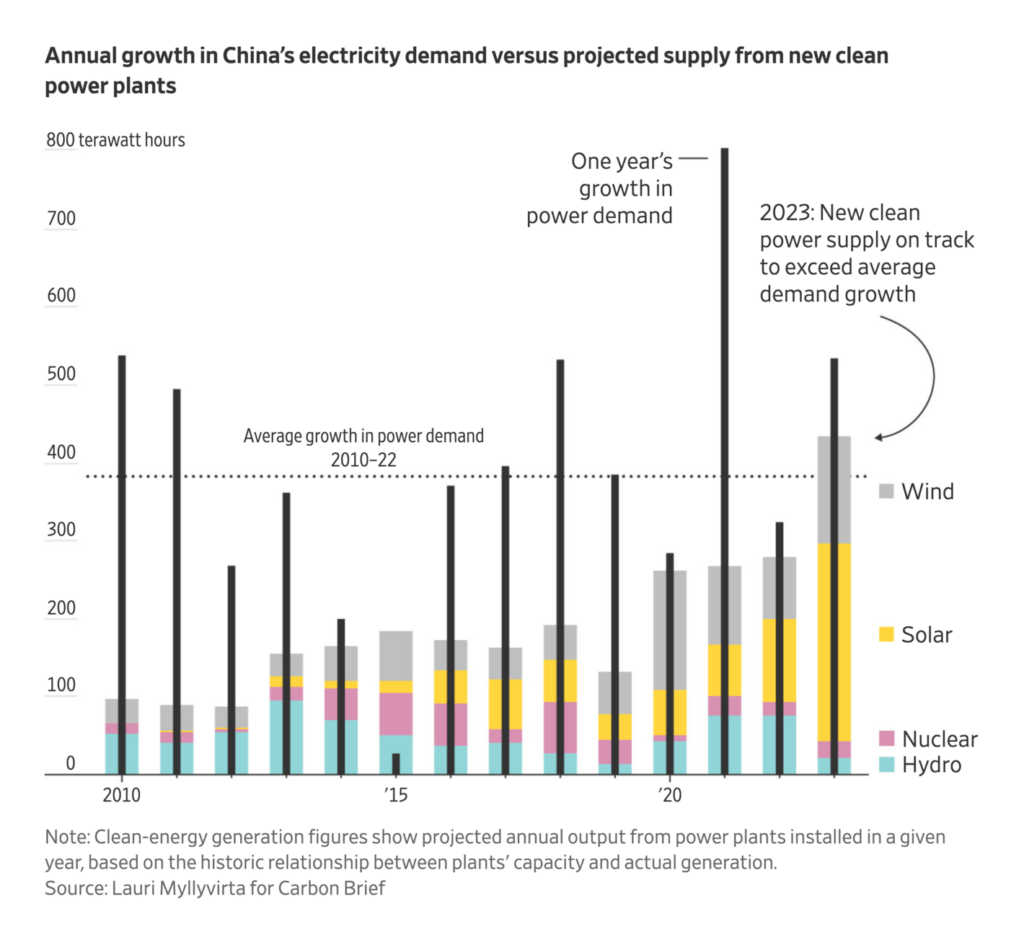
statsandgraphs: “Electrification of road transport will be crucial to achieving emissions reductions and limiting global warming over the coming decades…,” April 26 (Instagram)CNBC Chart of the day: “Shares of Tesla rose sharply on Monday, on pace for their best day since March 2021, after the electric carmaker passed a significant milestone to roll out its advanced driver-assistance technology in China…,” April 29 (Instagram)The Wall Street Journal: Air Conditioning and AI Are Demanding More of the World’s Power—Renewables Can’t Keep Up, April 26
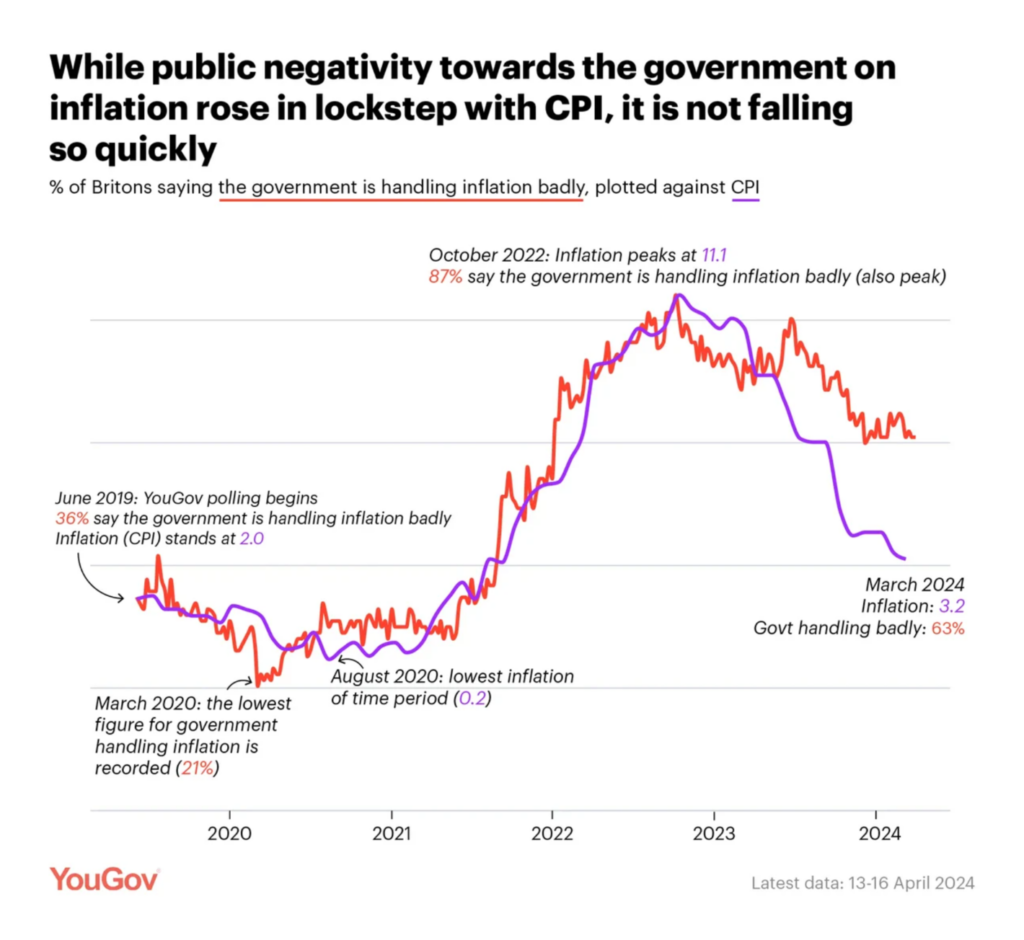
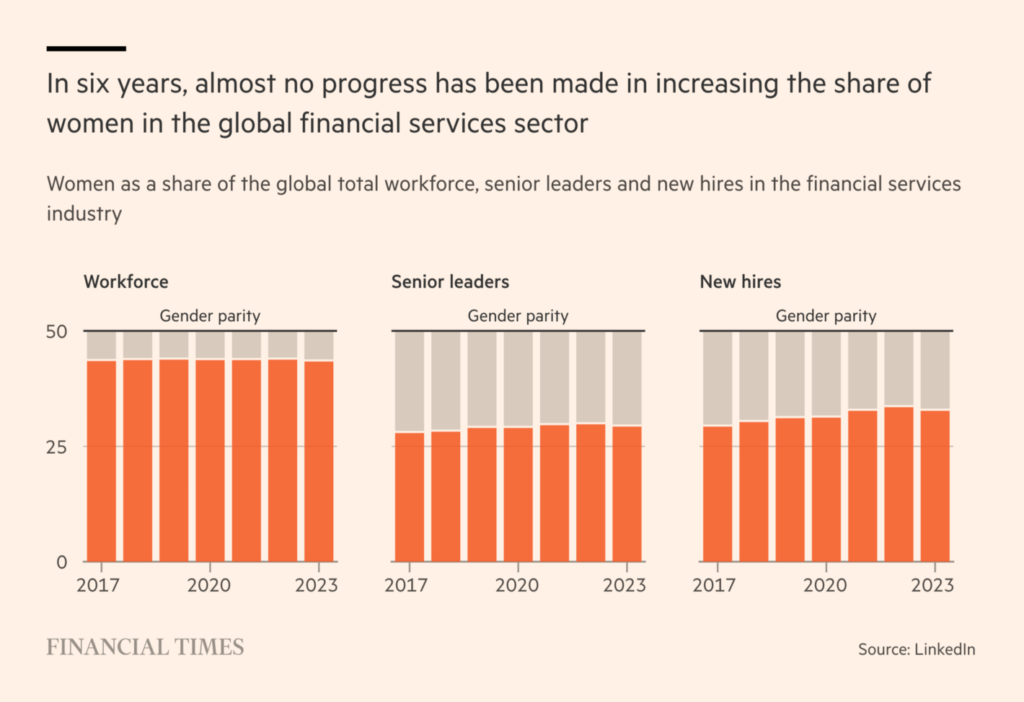
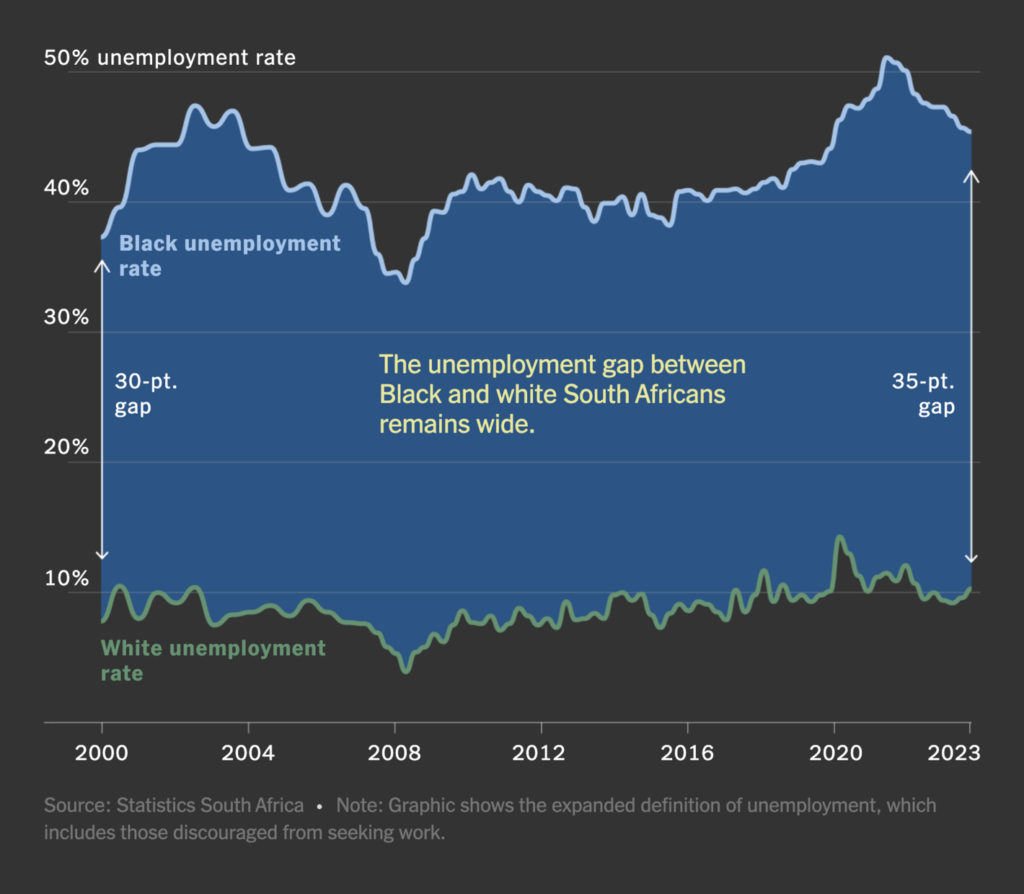
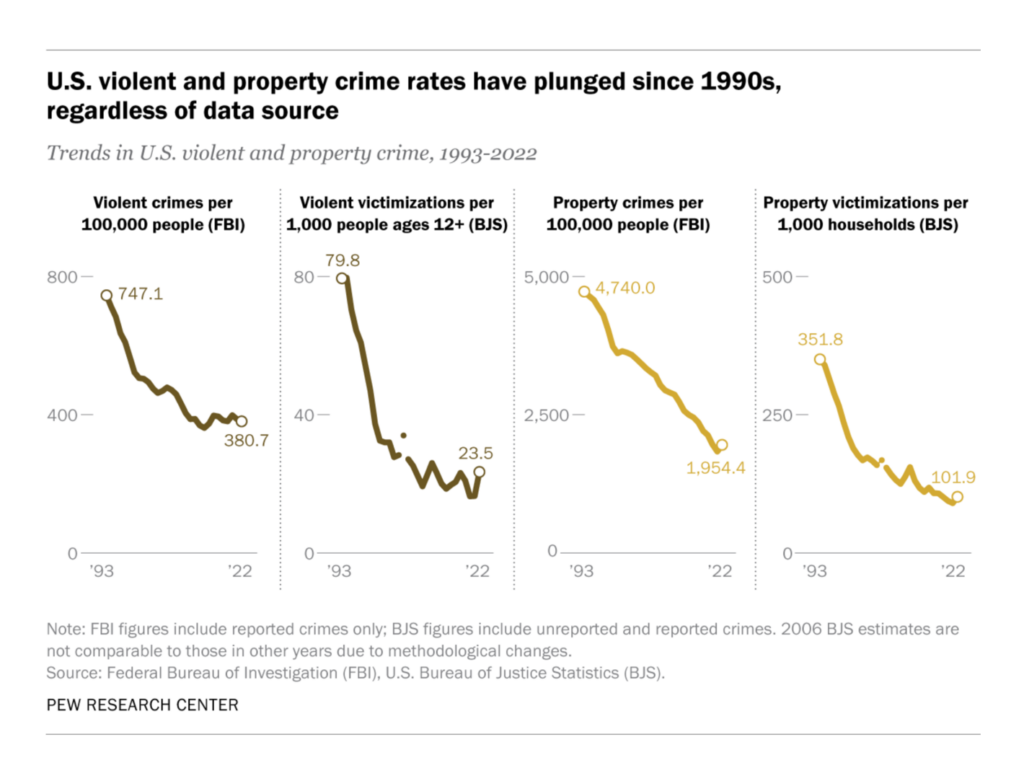
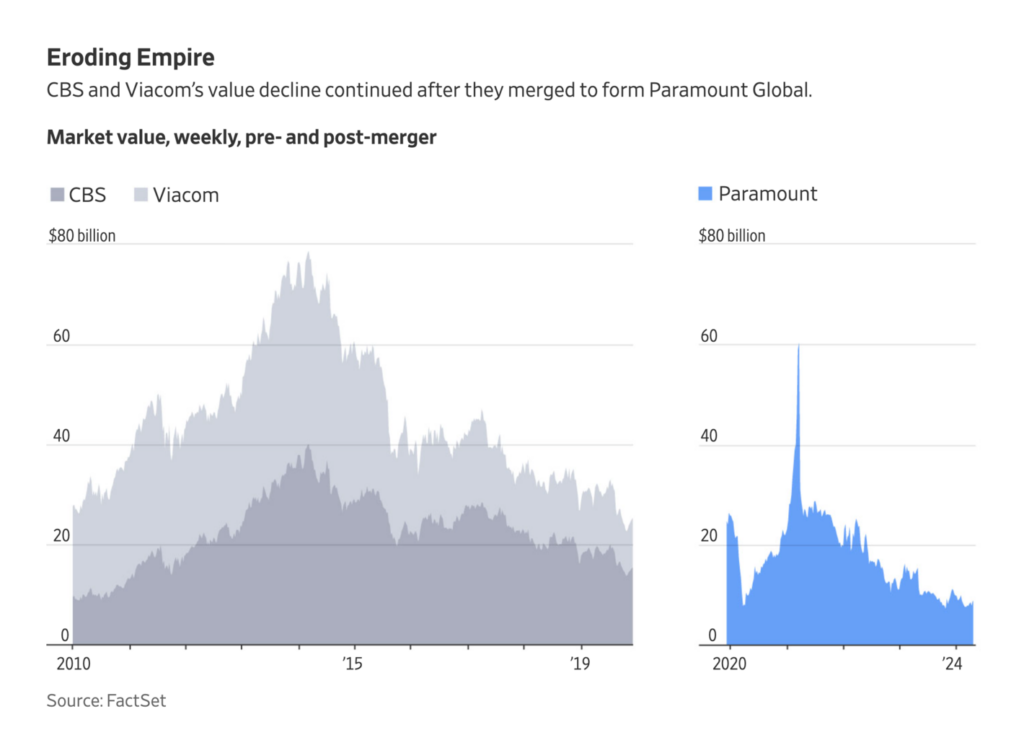
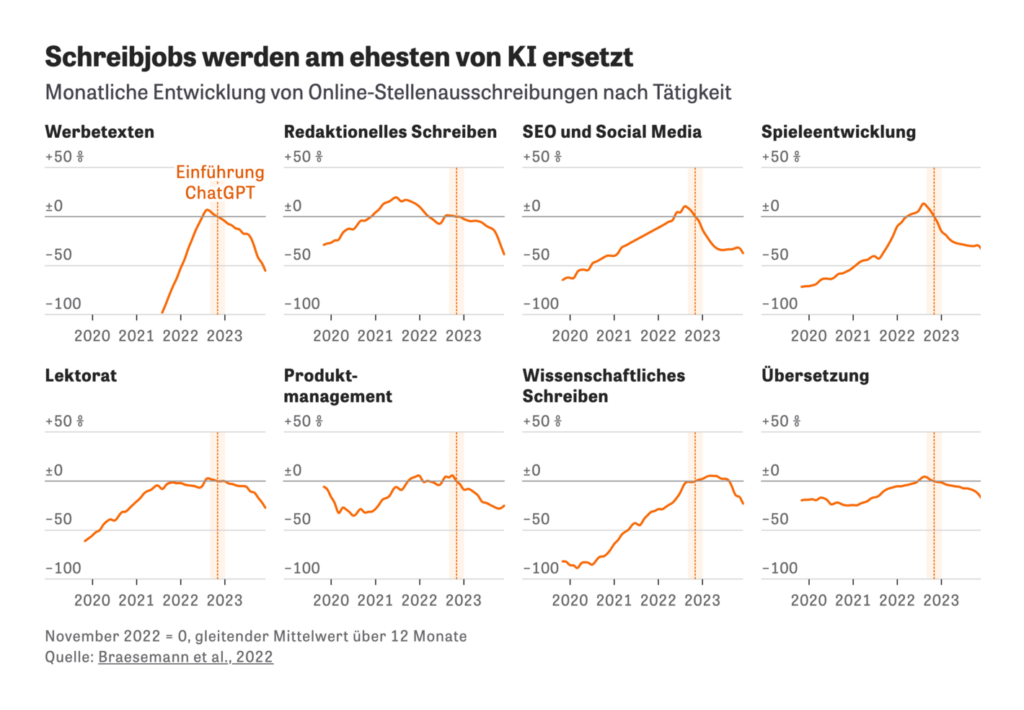
Charts are often interesting because they show clear upward or downward trends. Here are two examples that are intriguing because they don’t trend in any direction (plus one example where we fortunately see a strong downward trend):
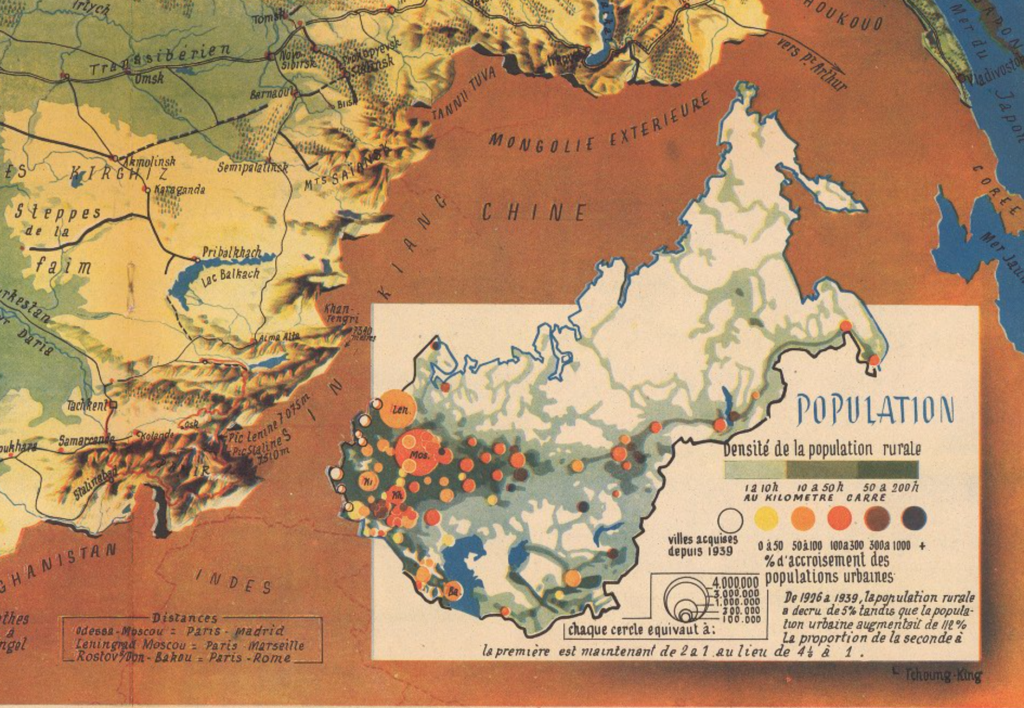
SUR: Llega el cuco, llega la primavera, April 24The Pudding: “The Flipbook Experiment has wrapped! Go check out the results and analysis,” April 22 (Tweet, Website)Xemartin Laborde: “Moi qui étais en pâmoison face au travail de R-E Harrison, M Tharp, E Raisz, H Berann, R Chapin, découvre grâce à @simongerman600 et le site de @DavidRumseyMaps le travail de Jacques Mercier, cartographe des années 1940 pour la revue 7 jours, et le résultat est 🤩,” April 24 (Tweet)
Help us make this dispatch better! We’d love to hear which newsletters, blogs, or social media accounts we need to follow to learn about interesting projects, especially from less-covered parts of the world (Asia, South America, Africa). Write us at hello@datawrapper.de or leave a comment below.
(she/her, @lisacmuth, @lisacmuth@vis.social) is Datawrapper’s head of communications. She writes about best practices in data visualization and thinks of new ways to excite you about charts and maps. Lisa lives in Berlin.
We have updated our Privacy Policy to reflect the new EU regulations. It is written with the goal of clarity. Please give it a read and accept it.Accept


Comments