

New: Automatically label data points in line charts
September 18th, 2024
3 min
This article is brought to you by Datawrapper, a data visualization tool for creating charts, maps, and tables. Learn more.
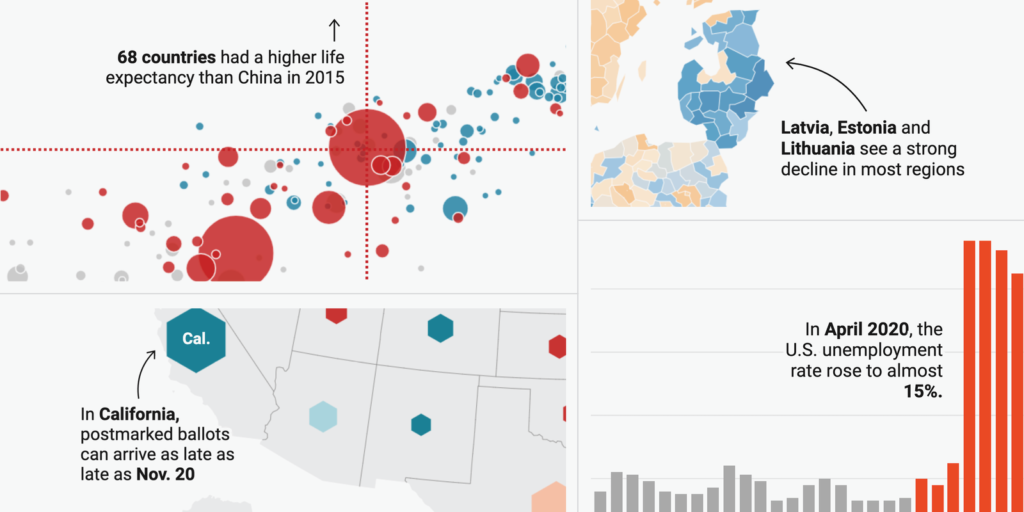
We’re excited to announce that you can now create text annotations in Datawrapper choropleth maps, symbol maps, (stacked) column charts, scatter plots, line charts, and area charts. Like so:
After launching our new map options, spike maps, and heatmaps for tables, this is the fourth big change we’re rolling out this fall.
So far, you could create annotations in our scatter plots, line and area charts, and – through markers – in our locator maps. Now we’re introducing them to more visualization types:
Use our new annotations…
Besides extending the number of chart types for which you can create annotations, we vastly improved how you create them:
With our new annotations feature, you can…
Overlapping or cropped annotations are annoying for you and your readers. We will always encourage you to check your visualizations with the “mobile” and “tablet” preview buttons in Datawrapper. But even if you do, it can be time-consuming to (re-)design annotations for mobile. We wanted to solve that. Here’s what we came up with:
On small screens, annotations get numbered and move below the chart. You can even change the order of the annotations in this new mobile view. Just drag them around in the annotation list.
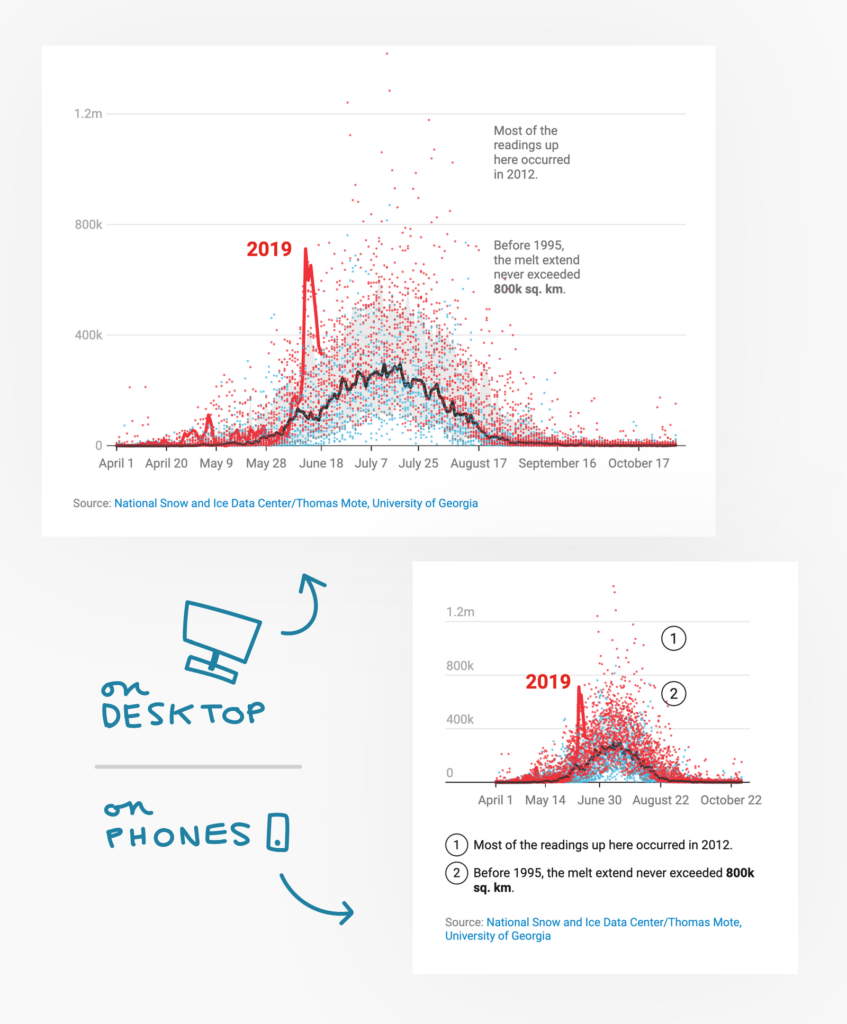
If you want certain annotations to always show up directly in your visualization, disable “Show as key on mobile” in the annotation settings. We did this here with the “2019” label.
Annotations resize with the visualization. The width of the annotations resizes relative to your chart or map. Here’s an example: If you create an 800px-wide chart and embed it in a 600px-wide article, your annotations become 25% narrower. The text wraps automatically, introducing more line breaks where possible.
The width of annotations is now measured in chart width, not in absolute pixels.
If you prefer the fixed width, simply delete the width in the annotation settings.
We also tweaked our “highlight range” feature. You can now add horizontal and vertical ranges and lines to scatter plots, line charts, area charts, column charts and stacked column charts if you upload a date column.
Here, too, we added more options: Edit the color and opacity of multiple range highlights at the same time, create dashed lines and change their width, or adjust the position of the highlights directly on the chart.
When trying out our new text annotations and range highlights, you might notice that the Refine tab loads faster after switching to another chart type; that things, in general, run a bit smoother. That’s because we rewrote the complete step 3: Visualize in a framework called Svelte.
We’ve been working on this transition for months now, to make Datawrapper ready for the years and changes to come. As part of this process, we’ve slightly updated the interface step by step: tidying it up, hiding options you don’t need, and adding more explanations. Today we’re bringing the new controls to the last chart type, our scatter plots:

Bye bye, old interface. Hello, new one!
With this change and the big annotation update, it all comes together – with a snappier Datawrapper experience.
Datawrapper wants to enable you to easily communicate your data – in a beautiful, readable way. We hope that our new text annotations, range highlights, and the new, faster interface help you do exactly that.
As always, we love to hear from you. If you have questions about the new options or feedback, get in touch with us at support@datawrapper.de.


Comments