


New: Stay organized with a more powerful, faster visualization archive
June 25th, 2024
3 min
This article is brought to you by Datawrapper, a data visualization tool for creating charts, maps, and tables. Learn more.
Because what’s better than one pie? Multiple pies.
Pie charts – some hate them, some love them. We think they make sense in some cases. But since our pie charts have been available from the earliest Datawrapper version, they’ve looked a bit outdated for a while and didn’t come with many options. So our Ivan got to it. By now, he’s a bit fed up with pies and donuts. But I’m sure you’ll appreciate the improvements we’re proudly introducing today:
“Small multiples” are a way to show the same chart type, multiple times next to each other. They’re a great way to compare if your uncle ate as big of a slice from the apple pie as he ate from the pumpkin pie. Since they’re almost a chart type on their own, we added them as such to our chart selector: You can now create small multipies and multi…um…donuts with our new chart types “Multiple Pies” & “Multiple Donuts”.
Multiple pies and donuts share most of the options with their single variants. For example, you can display certain values or the total below pie charts, or below and inside donut charts. There’s just one setting that’s not available in small multiples because of space issues: outside labels. “Outside labels”, you ask? Yes! Let us serve you some more pie to explain another improvement:
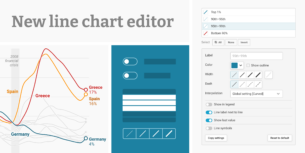
To make sure your visitors know what’s in a pie slice, we offer three different ways of labeling them: By default, you’ll see a color key, plus labels & values shown directly in a slice. But for those times when the extended family comes over and you want your pies & donuts a bit fancier, we now also offer outside labeling, with lines leading from the labels to the slices:
Try ending the lines at the edge of the slices as a variation. And to add some sprinkles of color (and better readability!), we suggest you use the slice color for the labels.
We couldn’t believe it ourselves, but so far, our pies and donuts didn’t have color keys. You know, these colored boxes with labels next to them. But now we have them. And they can be everywhere! At the top! At the bottom! To the left! To the right! Whatever you feel like. Here we felt like placing them to the right:
What’s more, you can decide to display the values next to the labels in the color key. So that your small slices get some attention, too.
Let us know if you have any questions or feedback for our new pie & donut charts. We’re always happy to hear from you. Find us on Twitter at @datawrapper or email us to support@datawrapper.de.
Comments