Data Vis Dispatch,
November 23

The best of last week’s big and small data visualizations

Welcome back to the 23rd edition of Data Vis Dispatch! Every week, we’ll be publishing a collection of the best small and large data visualizations we find, especially from news organizations — to celebrate data journalism, data visualization, simple charts, elaborate maps, and their creators.

Recurring topics this week include COVID in Europe, maternal mortality in the U.S., and maps of water.

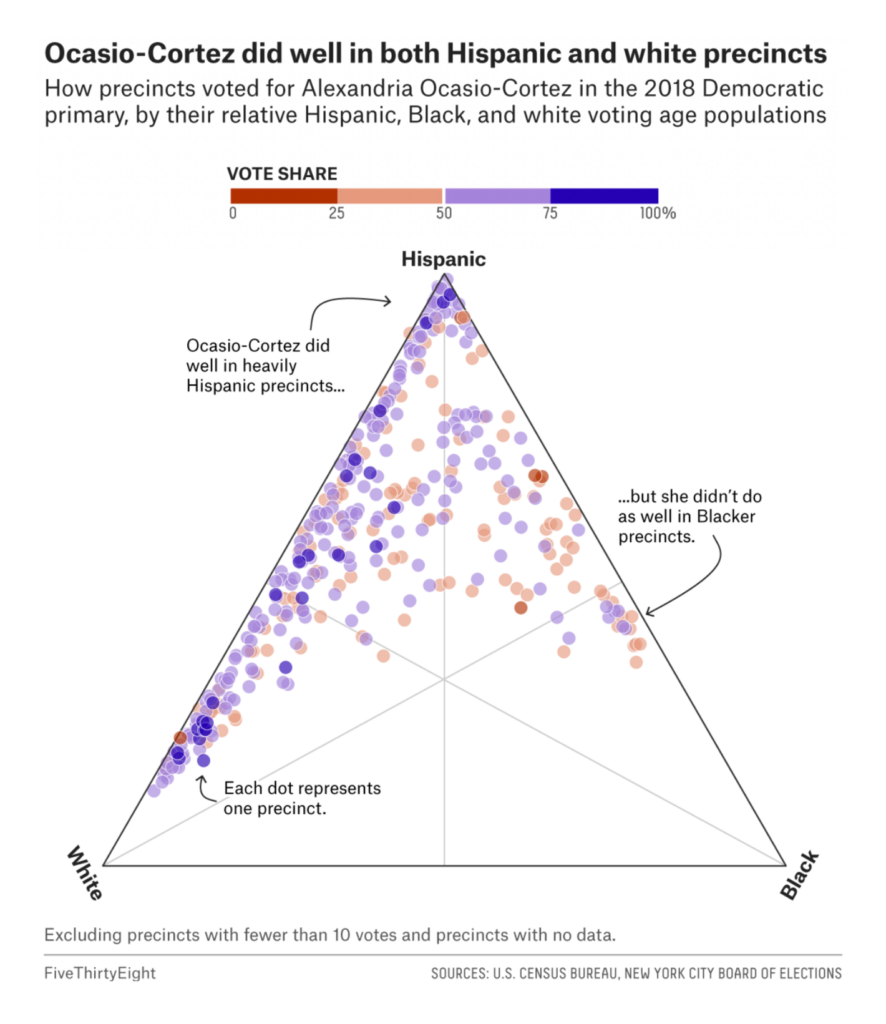
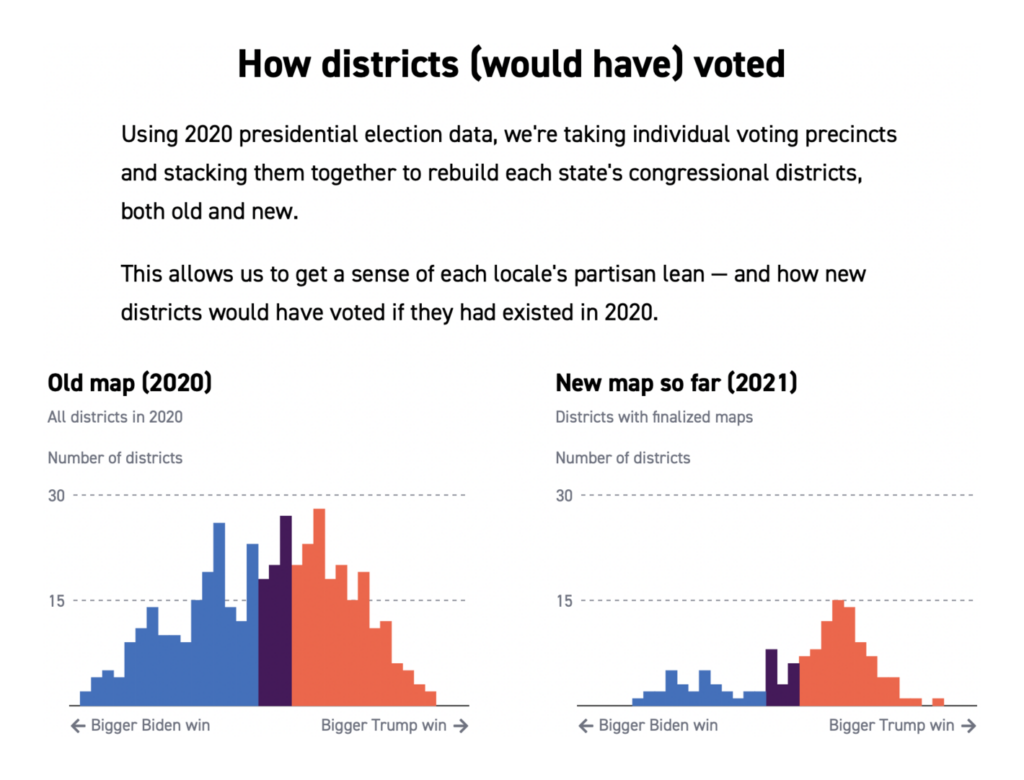
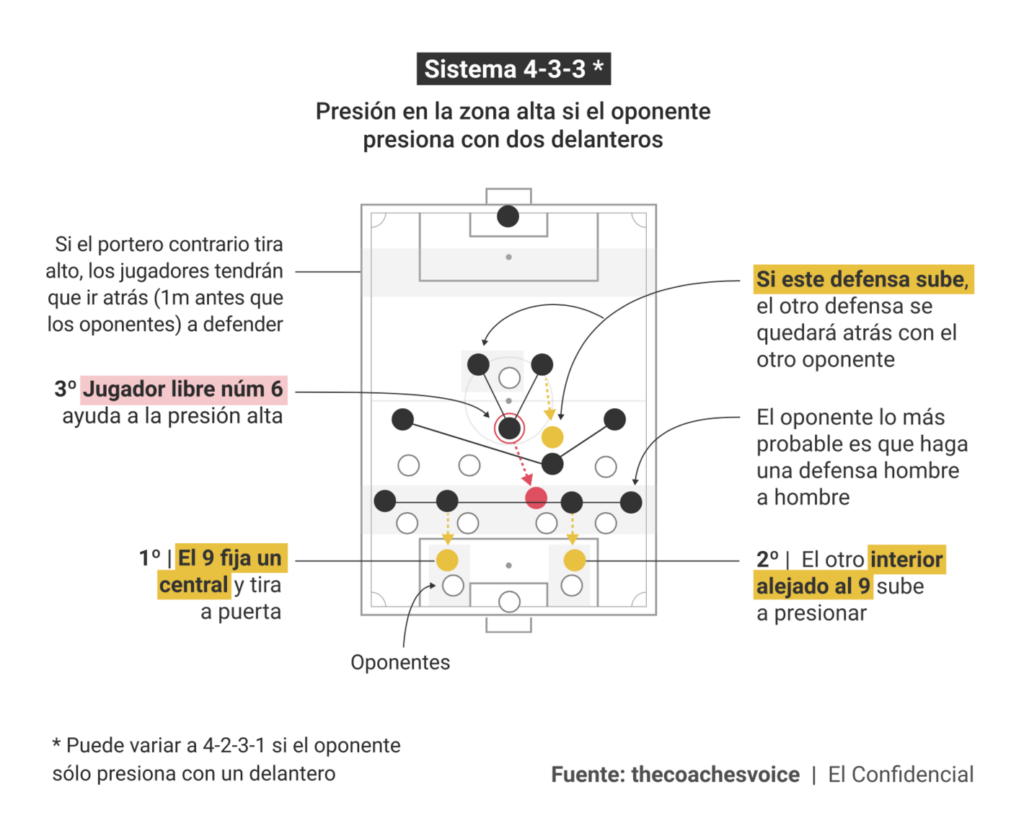
Let’s kick things off with charts on political and economic issues. Of course that includes elections:

FiveThirtyEight: What ‘The Squad’ Tells Us About Progressives’ Ability To Win Voters Of Color, November 22
Politico: States are redrawing every congressional district in the U.S. Here is where we stand, November 18

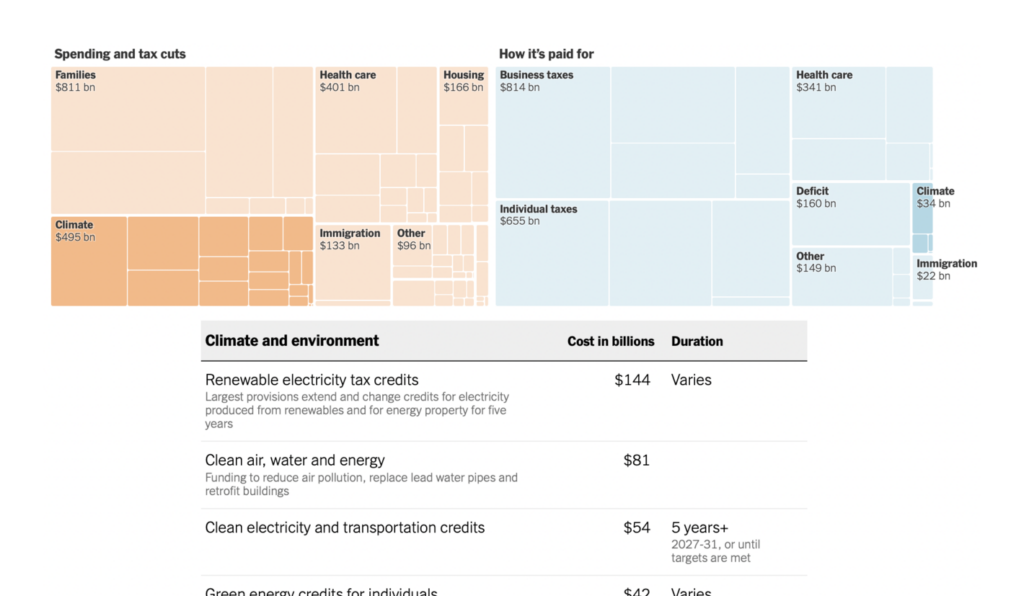
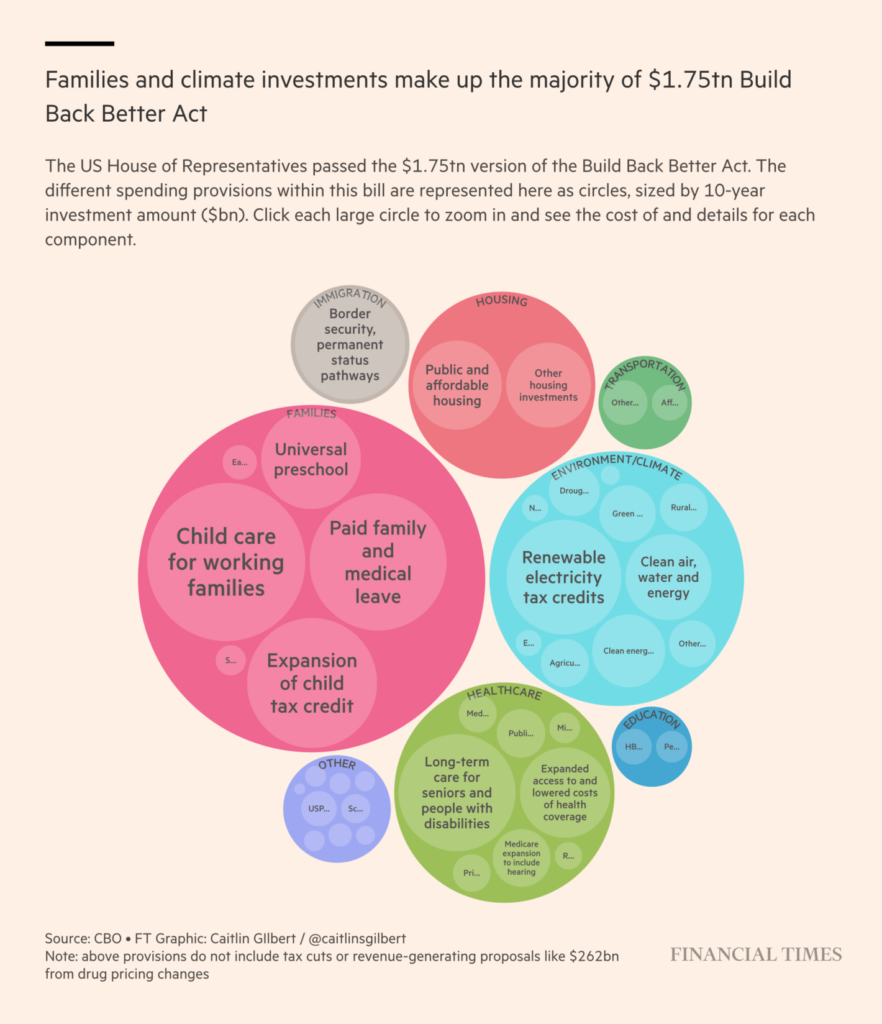
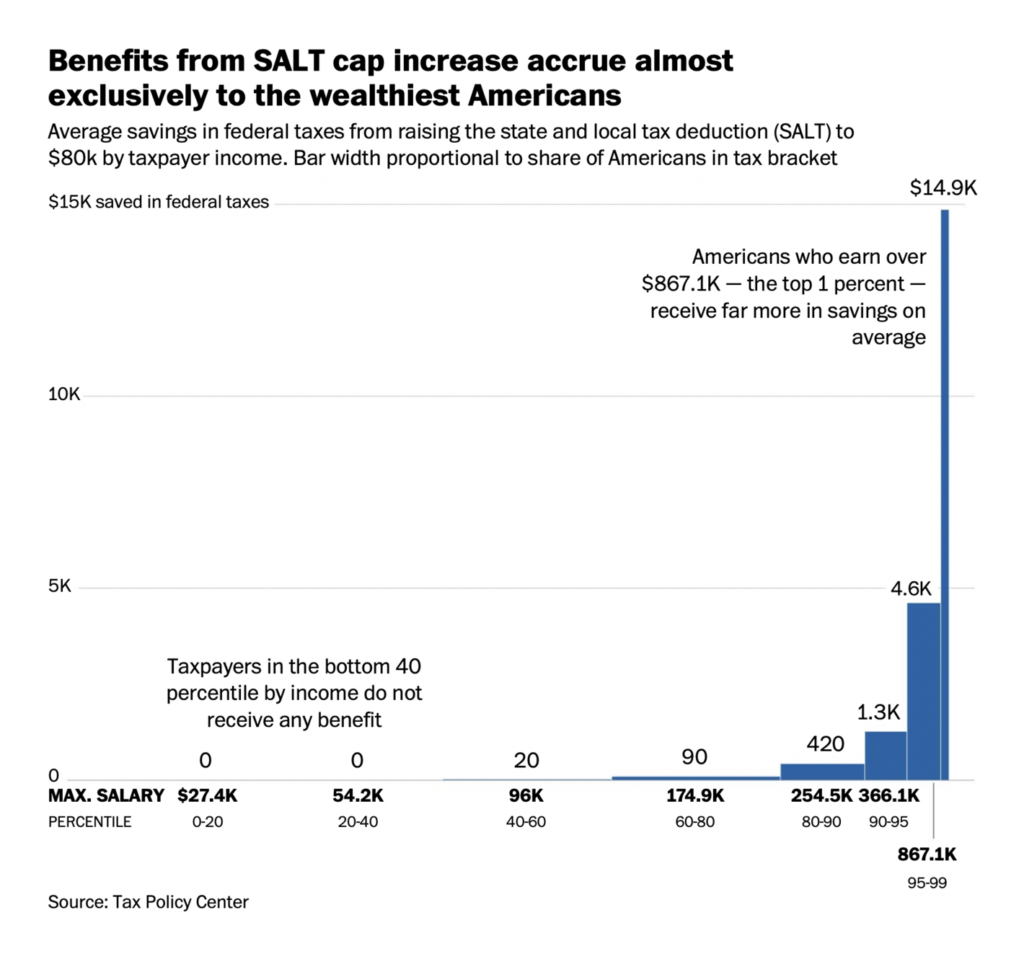
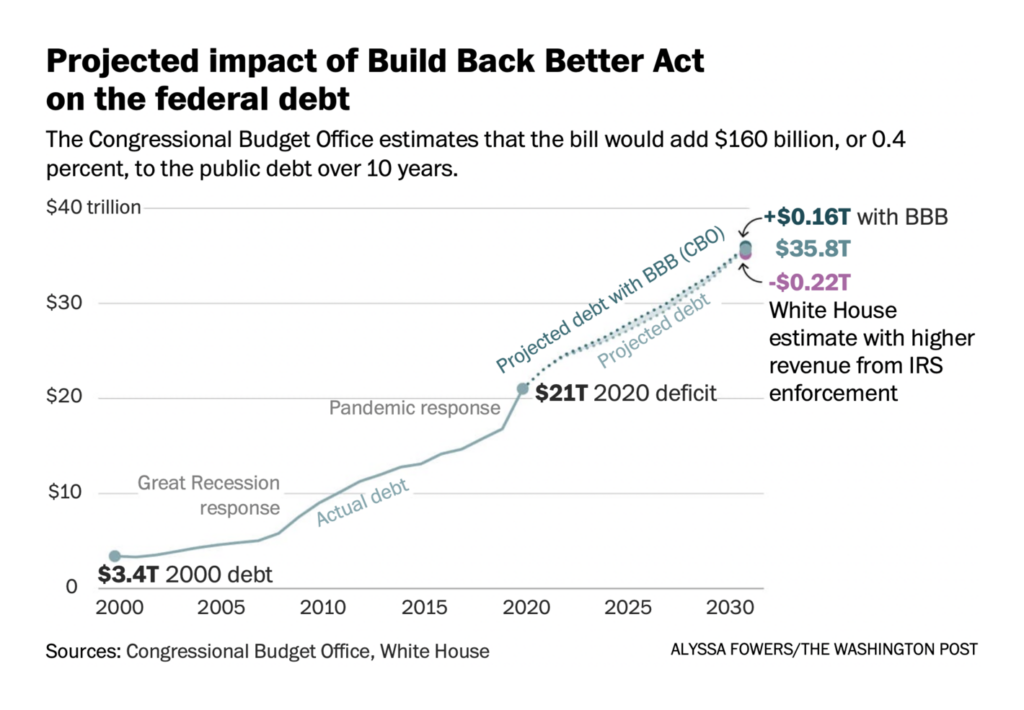
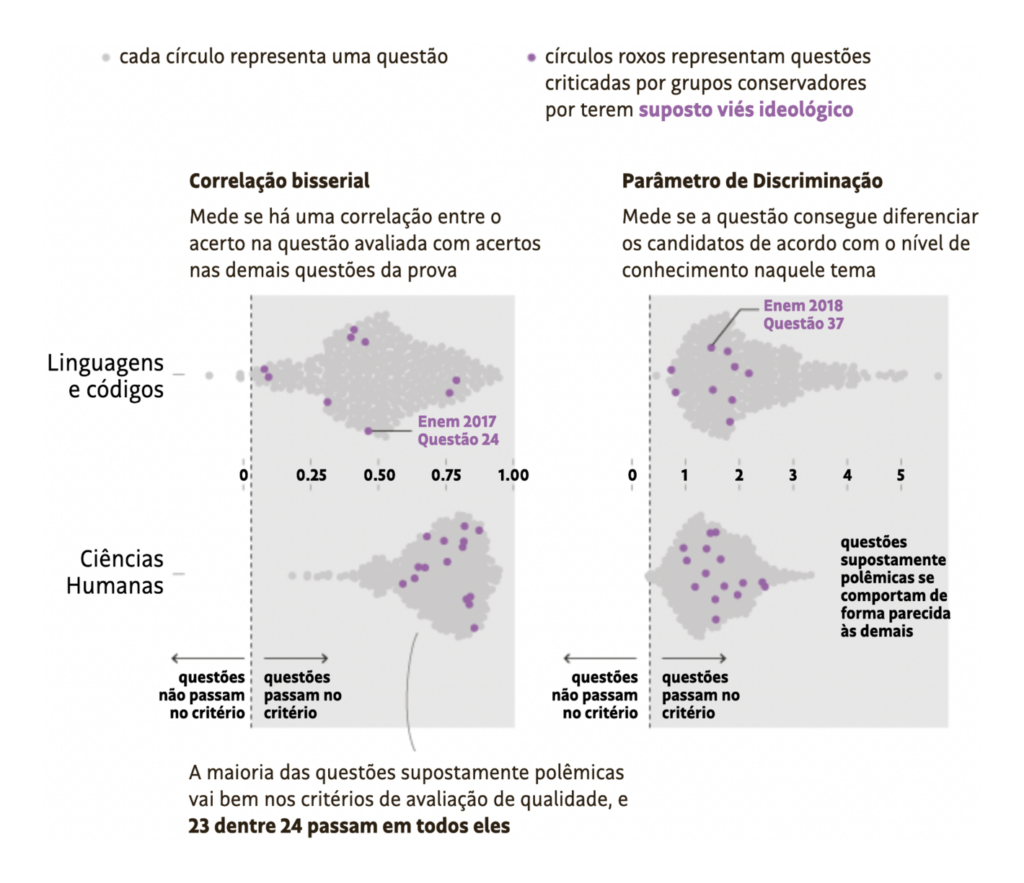
But the biggest single story in political charts was legislative — the contents and would-be effects of the U.S. “Build Back Better” bill:

The New York Times: Everything in the House Democrats’ Budget Bill, November 18
Financial Times: Biden’s landmark spending bill faces next battle in Senate, November 20
The Washington Post: The second-biggest program in the Democrats’ spending plan gives billions to the rich, November 16
The Washington Post: House passes roughly $2 trillion spending package that would expand social benefits and fight climate change, November 19

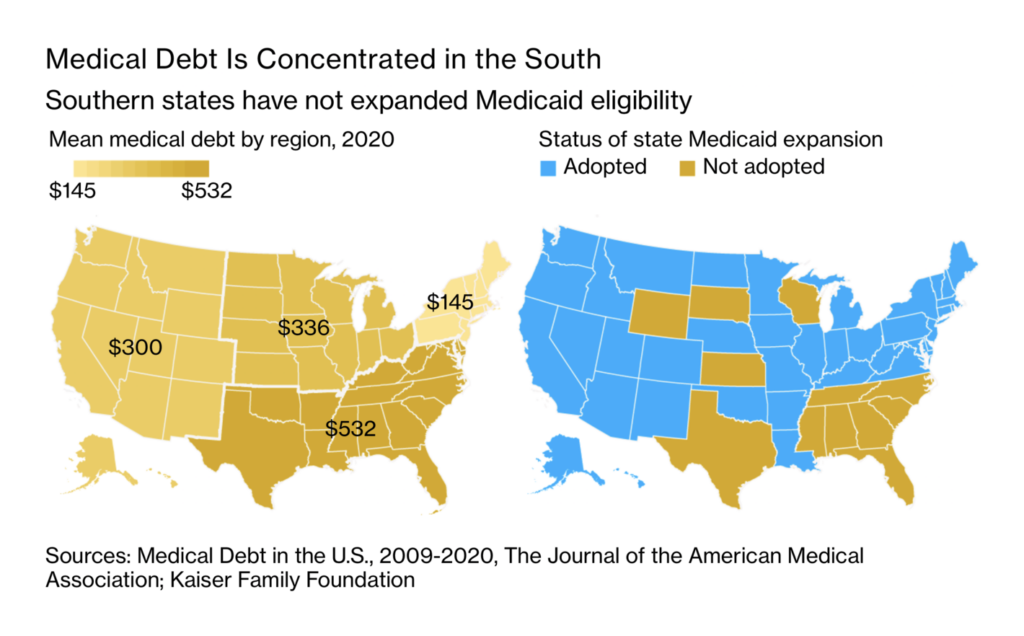
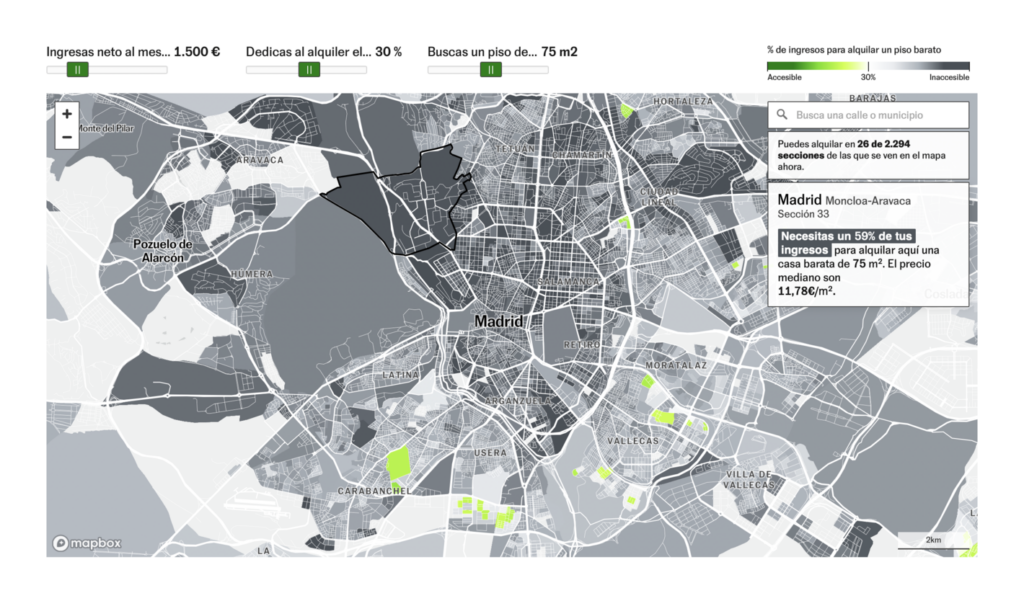
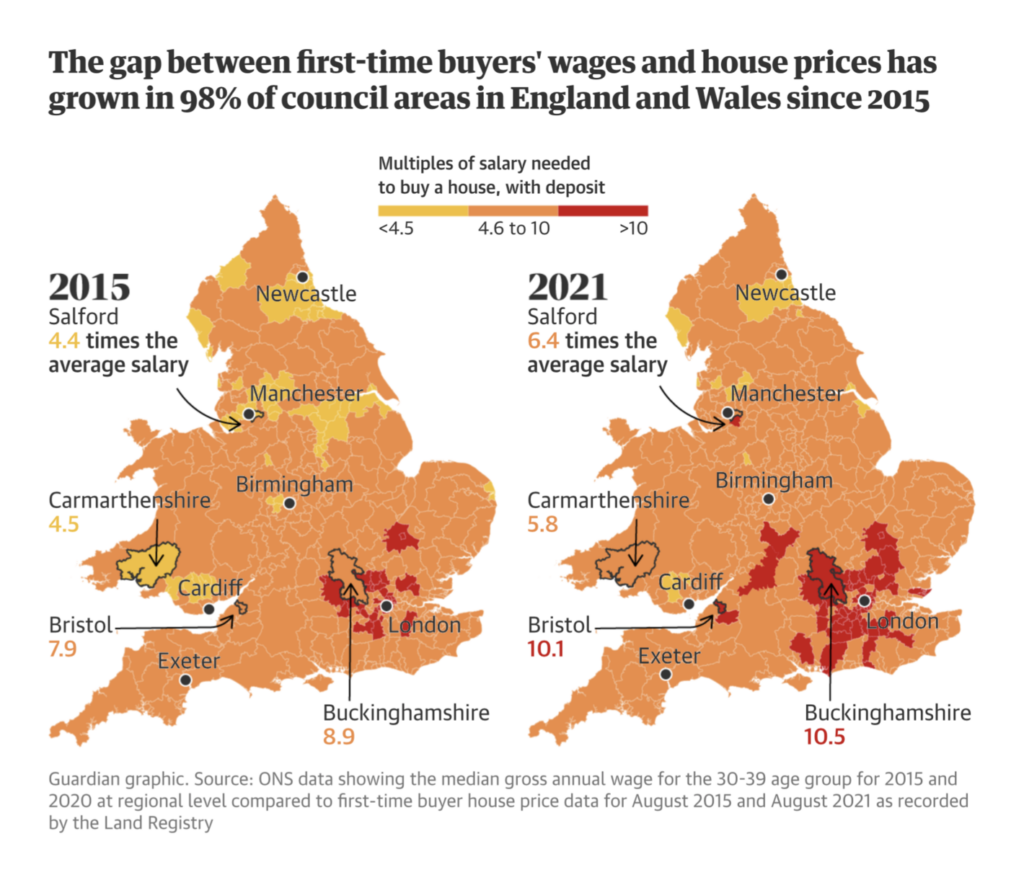
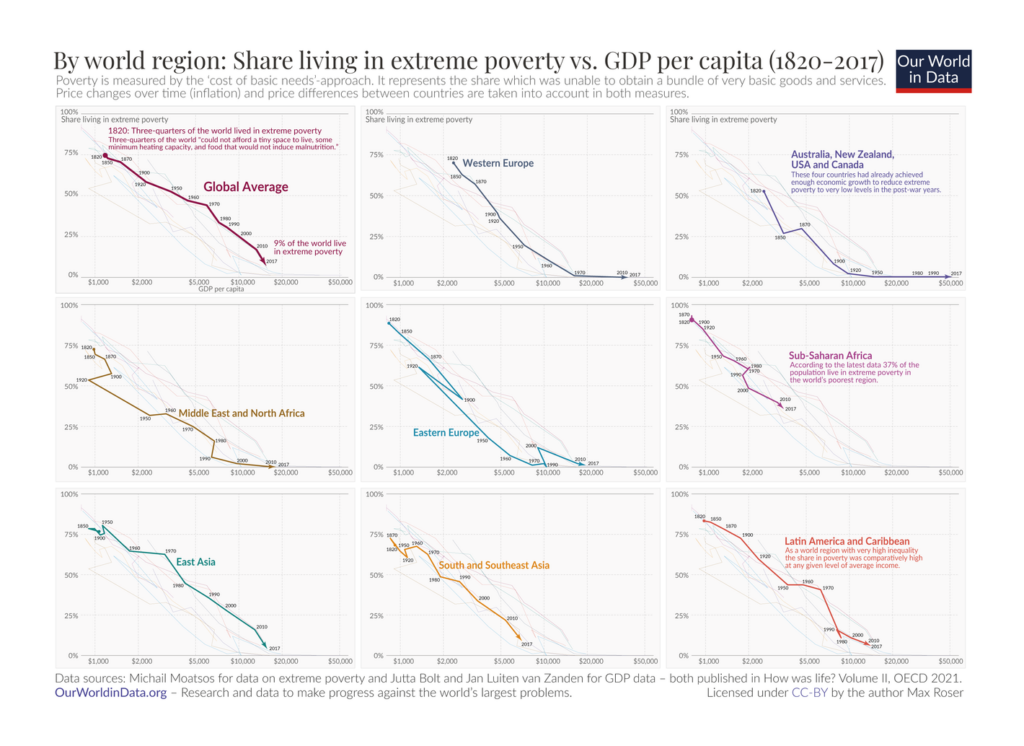
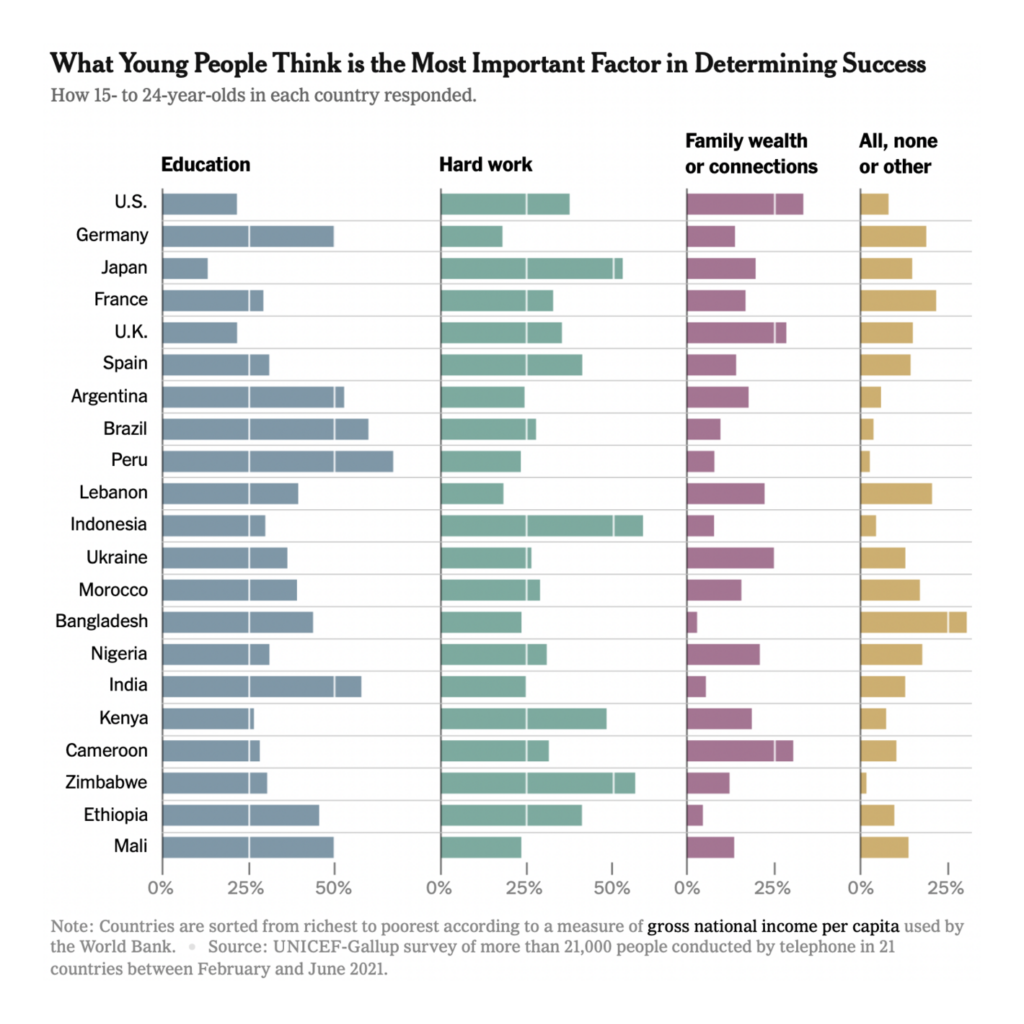
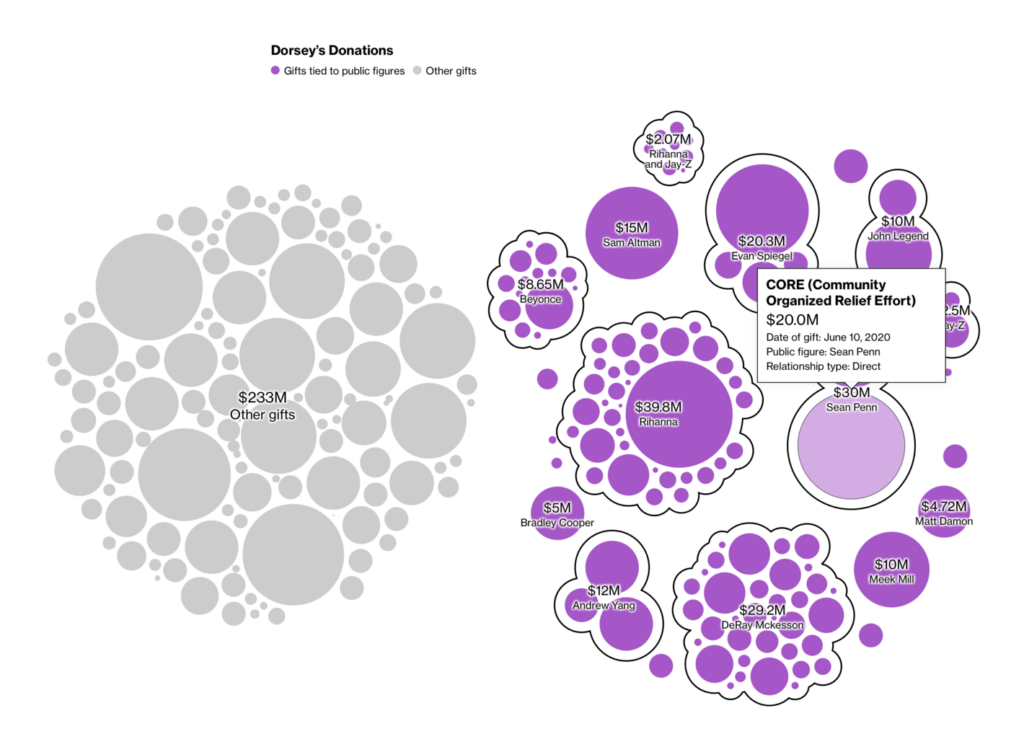
And even more charts looked economically downstream at issues of poverty, equality, and cost of living:

Bloomberg: Medical Debt Is Crushing Black Americans, and Hospitals Aren’t Helping, November 22
Bloomberg: Georgia Shows Just How Broken American Unemployment Benefits Are, November 19
El País: ¿Quién puede alquilar y dónde? El mapa del acceso a la vivienda, calle a calle y familia por familia, November 21
The Guardian: Revealed: first-time homes have grown less affordable under the Tories, November 22
Our World in Data: Extreme poverty: how far have we come, how far do we still have to go?, November 22
The New York Times: Where Are Young People Most Optimistic? In Poorer Nations, November 17

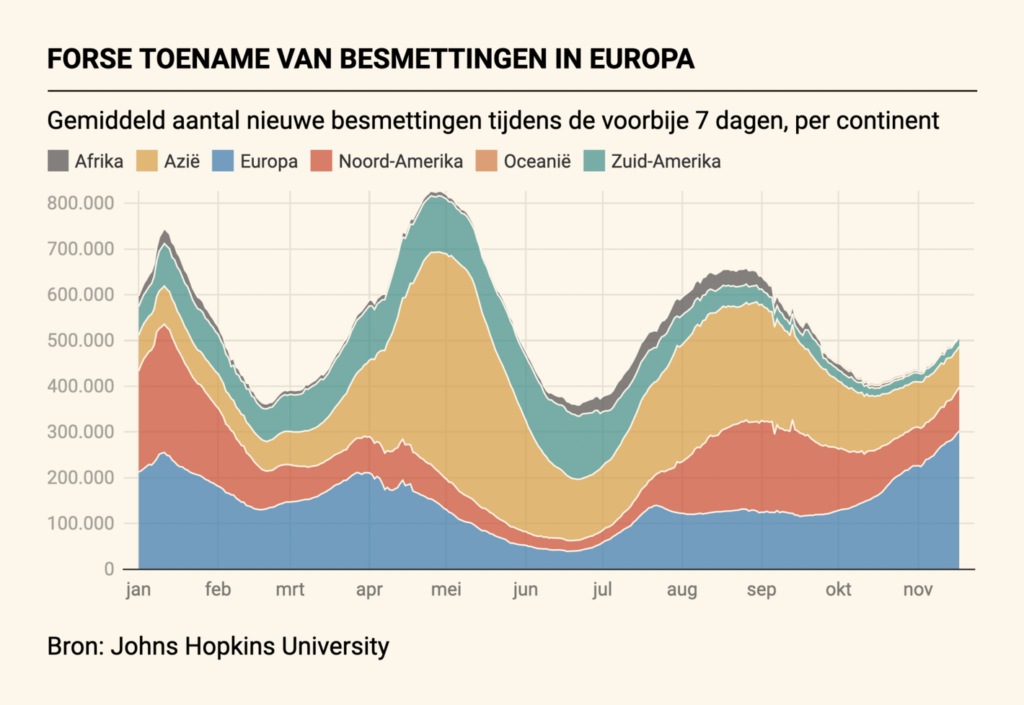
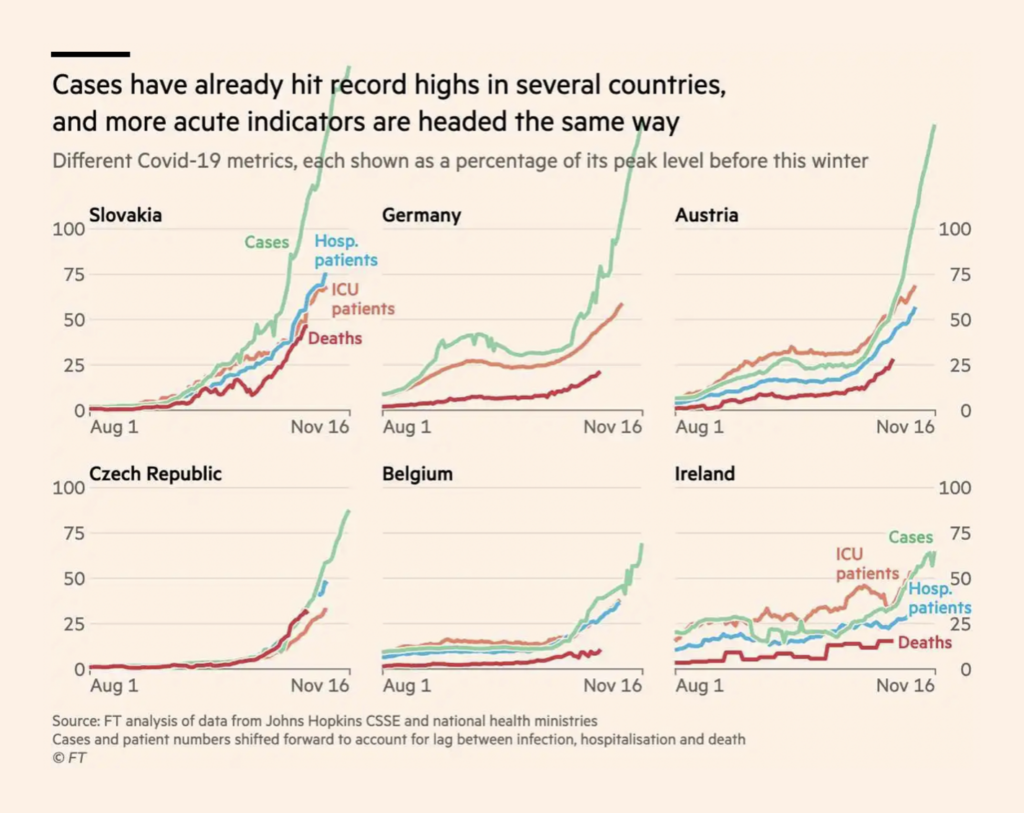
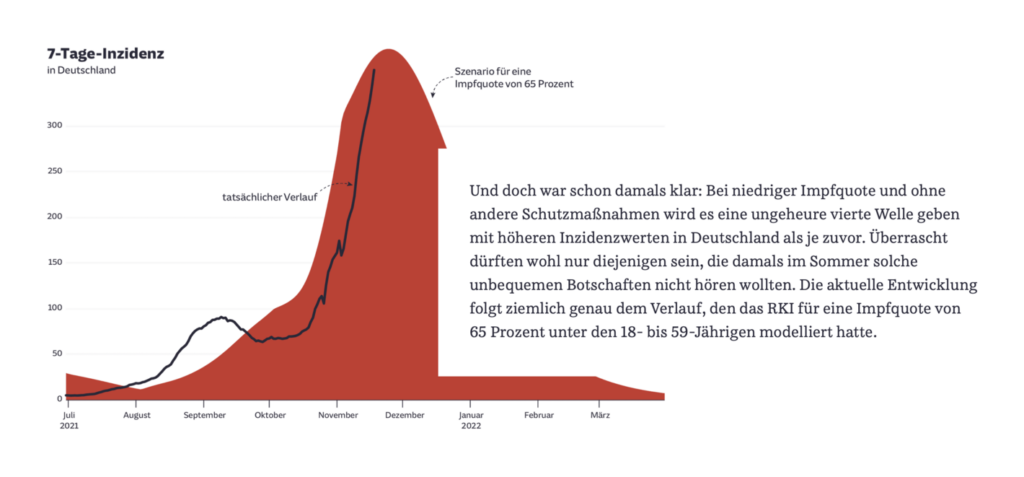
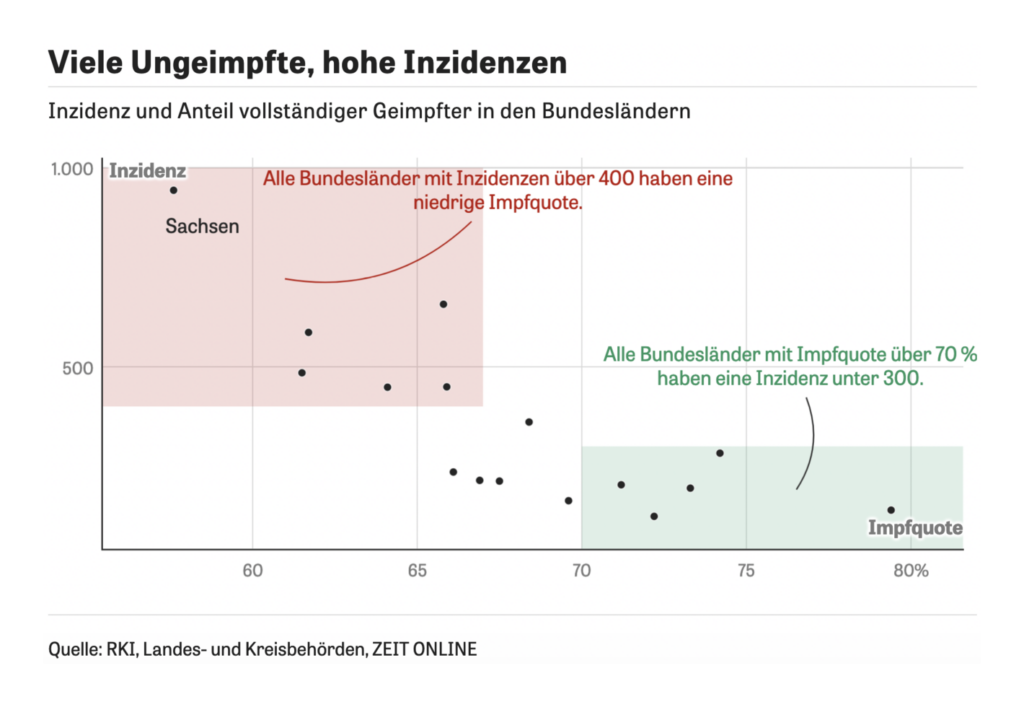
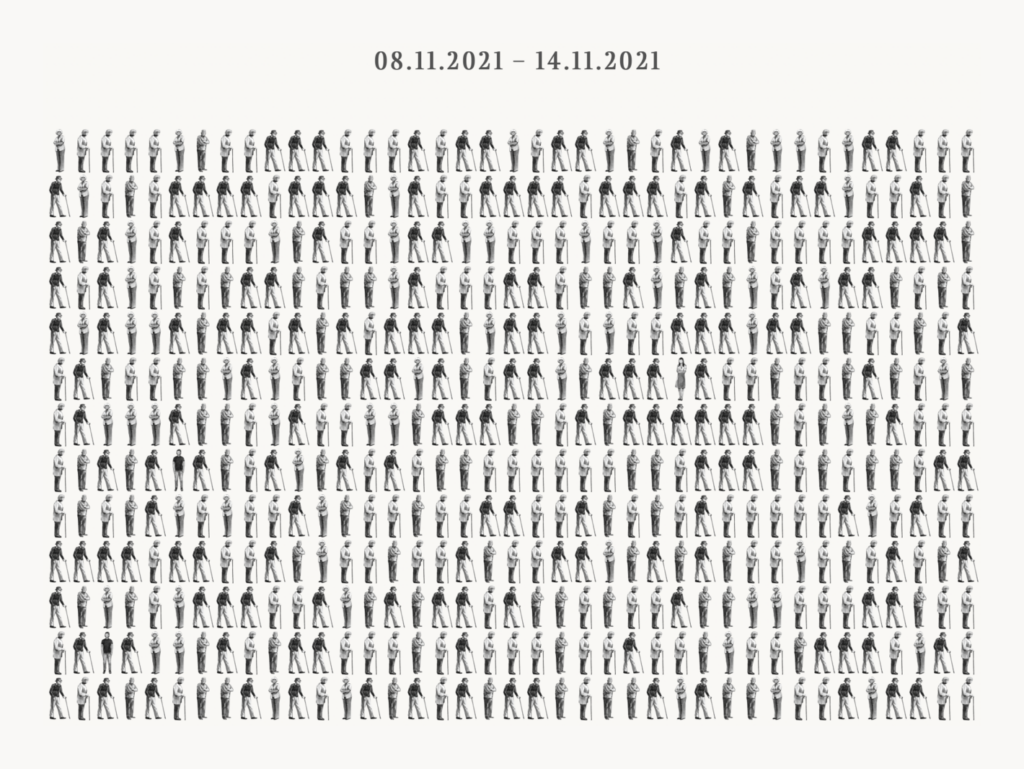
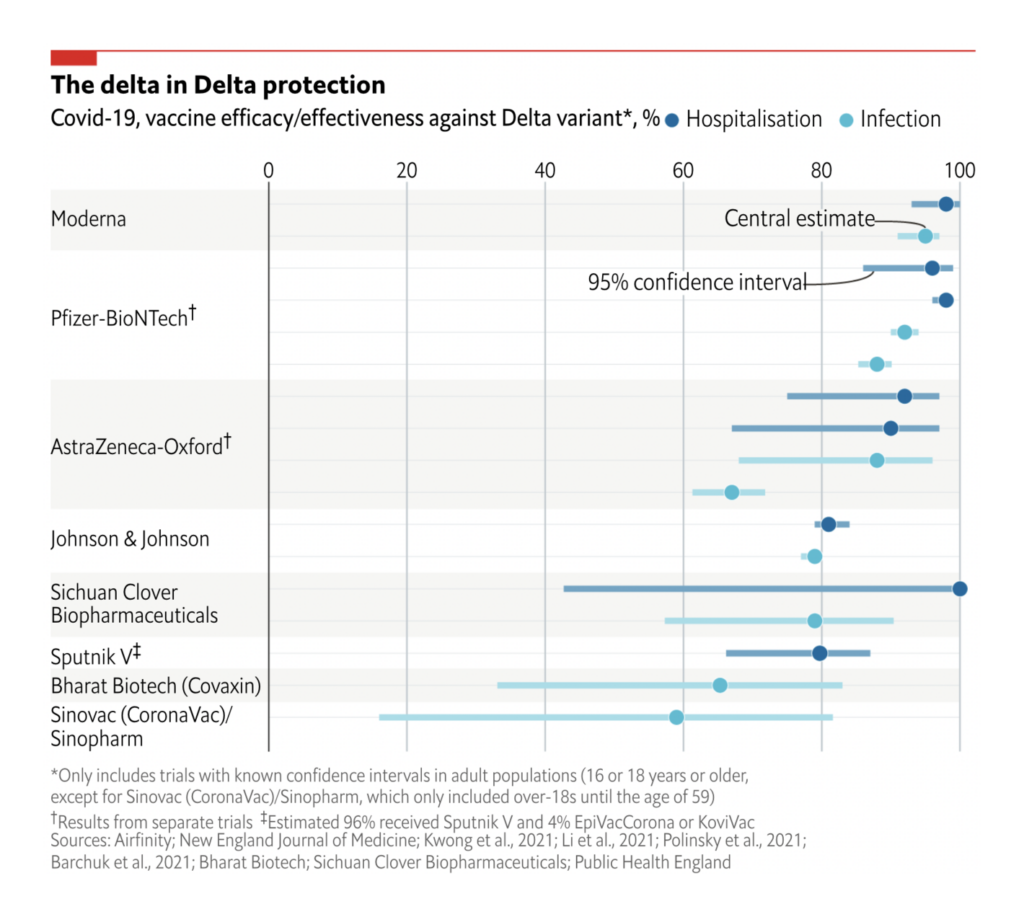
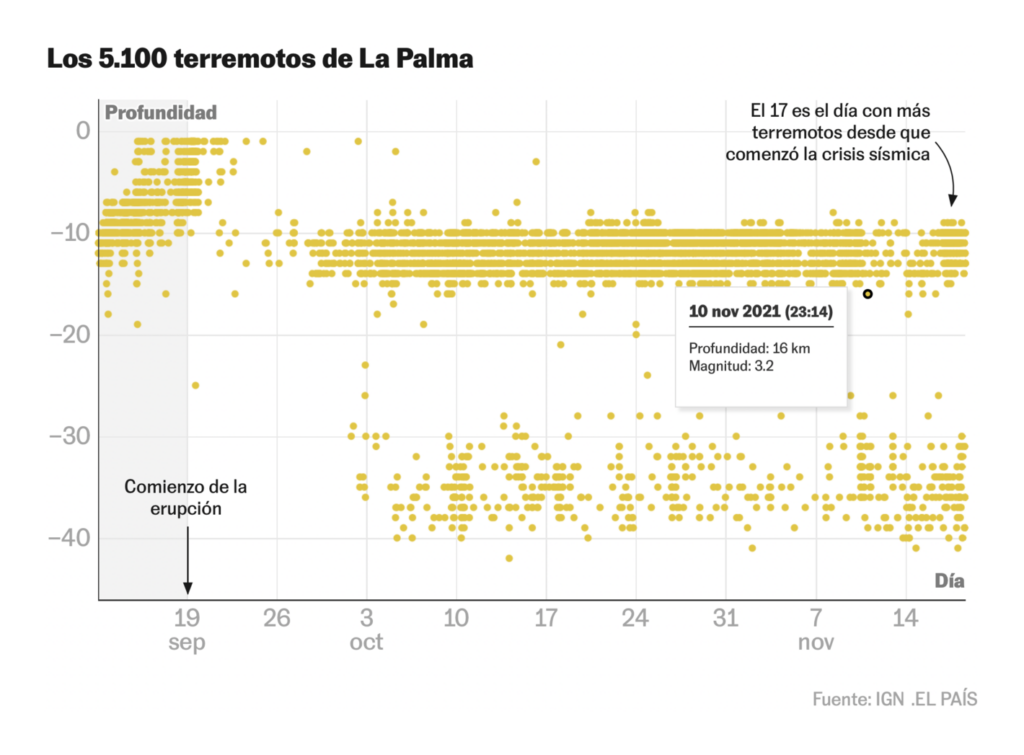
COVID cases are soaring in Europe — and as the Süddeutsche Zeitung points out, what we’re seeing is exactly what was forecast for the current level of vaccination:

De Tijd: Corona wereldwijd | België coronakoploper in West-Europa, November 18
Financial Times: European countries bring back Covid restrictions as cases rise, November 17
Süddeutsche Zeitung: Was zu erwarten war, November 19
Zeit Online: Reicht das noch?, November 19
Süddeutsche Zeitung: 100.000 Corona-Tote: Die Schicksale hinter den Zahlen, November 19

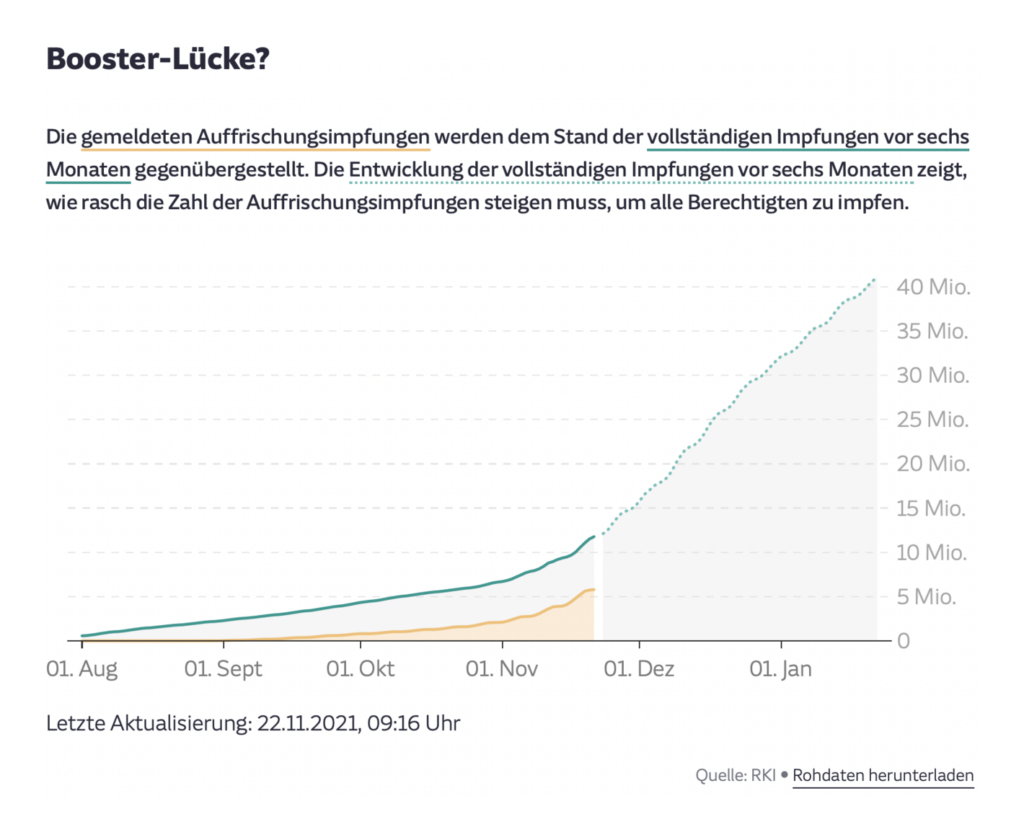
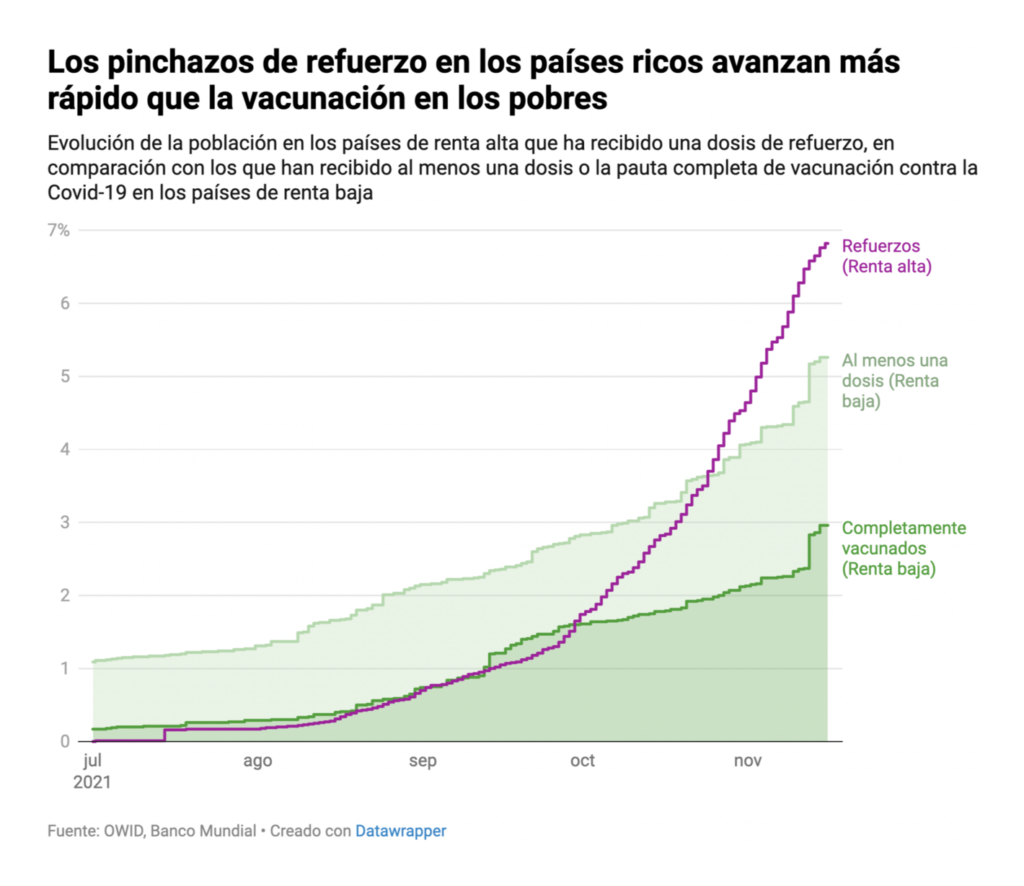
So yes, vaccines work really well. Unfortunately, the pace of booster vaccination is lagging well behind the speed of the first rounds. And even more unfortunately, even that limited rollout has already surpassed first-dose vaccination in poor countries:

The Economist: Which vaccine is the most effective against the Delta variant?, November 17
Süddeutsche Zeitung: Wie gut ist Deutschland geschützt?, November 19
El Diario: Los vacunados con tres dosis en los países ricos superan a la población con una en los más pobres, November 17

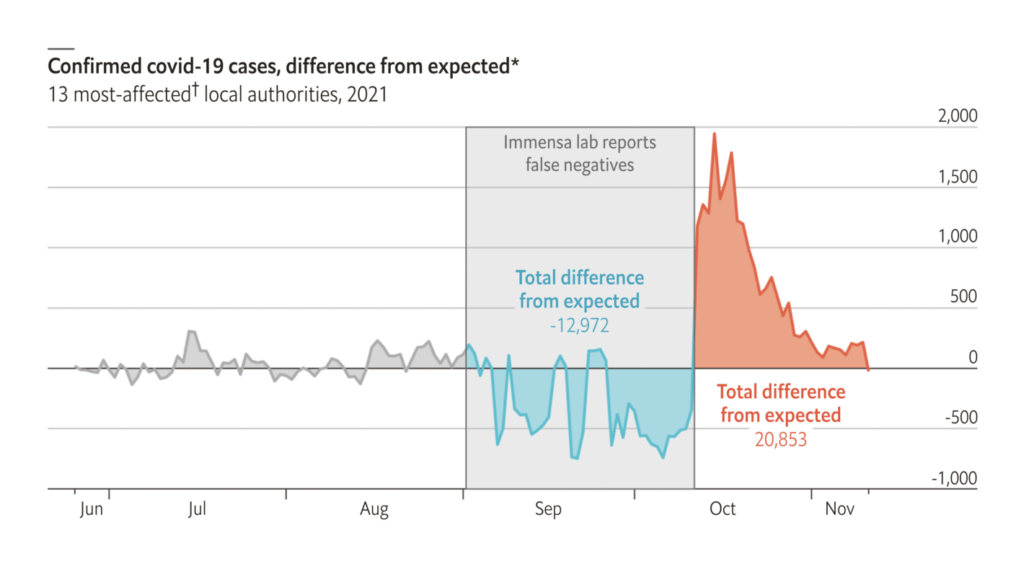
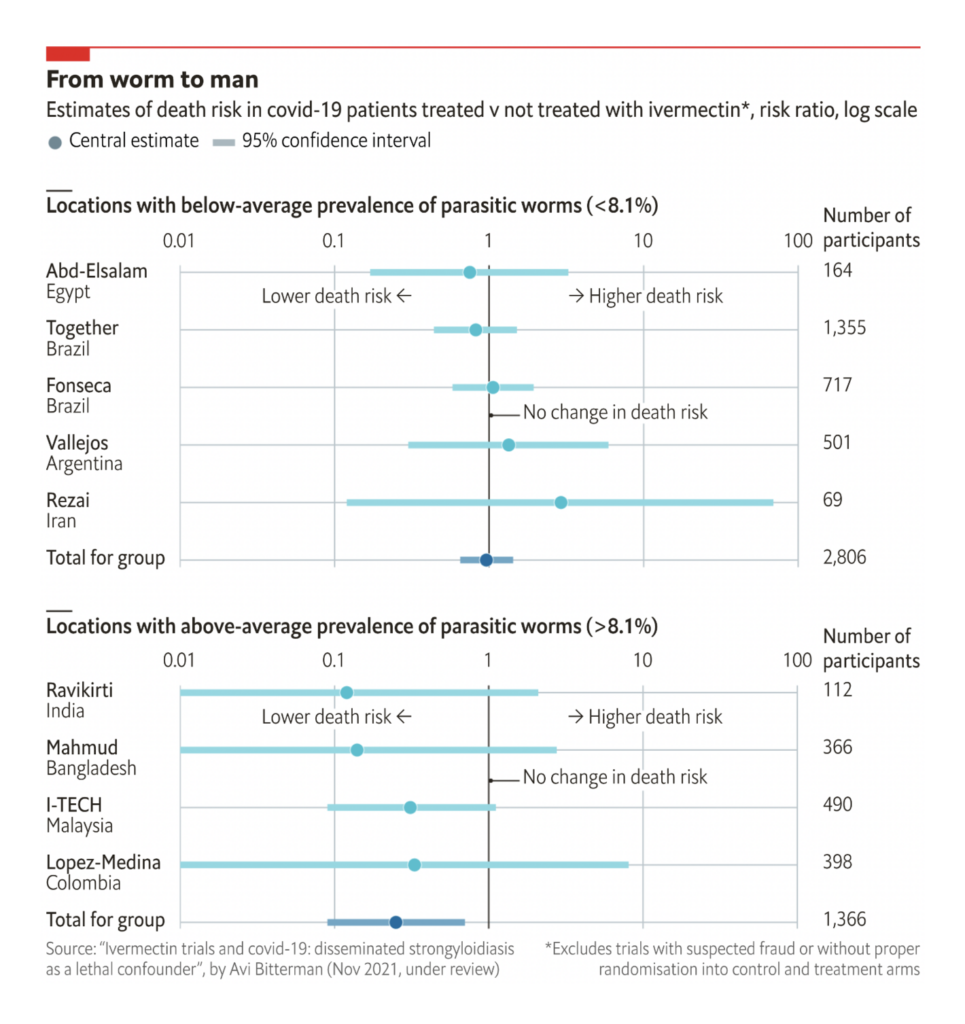
Besides vaccines, what else is helping us through the pandemic? Testing helps, as an unfortunate natural experiment in Britain has shown. And a new analysis shows that the drug ivermectin may have helped some patients after all — for a very straightforward reason:

The Economist: Botched covid-19 test results in Britain led to thousands of extra cases, November 20
Axios: Fear and loneliness caused surge of early pandemic calls for help, November 18
The Economist: Ivermectin may help covid-19 patients, but only those with worms, November 18

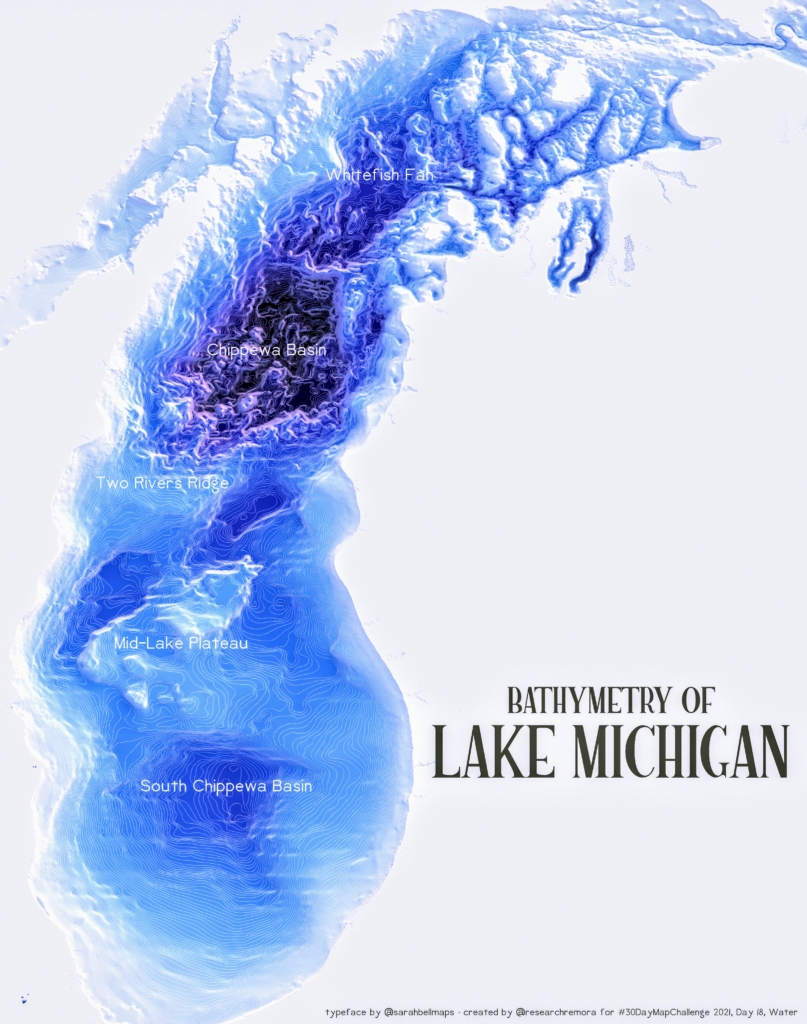
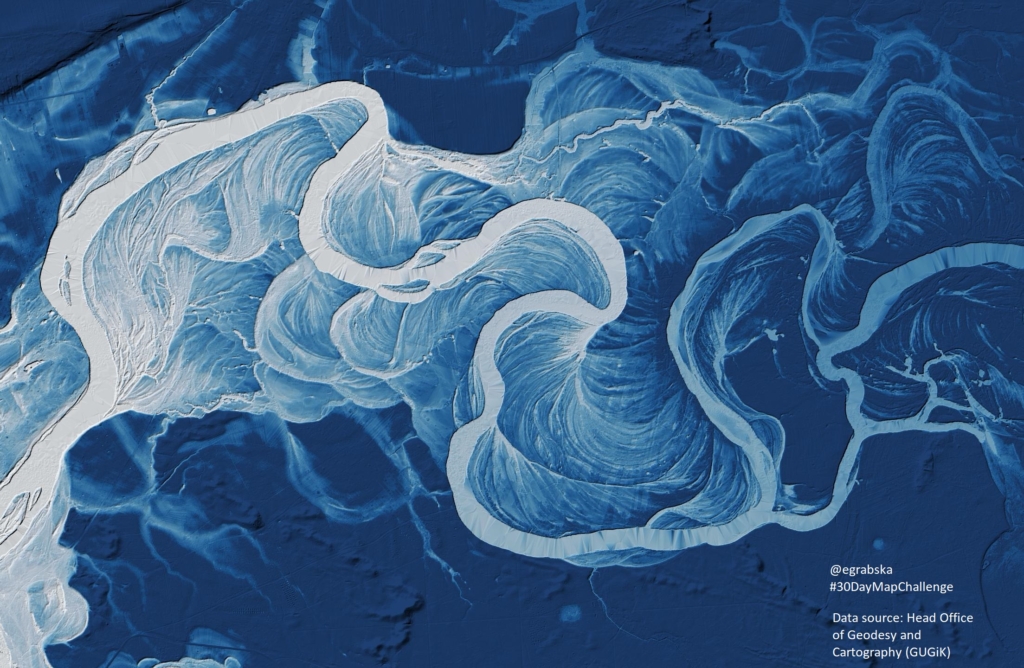
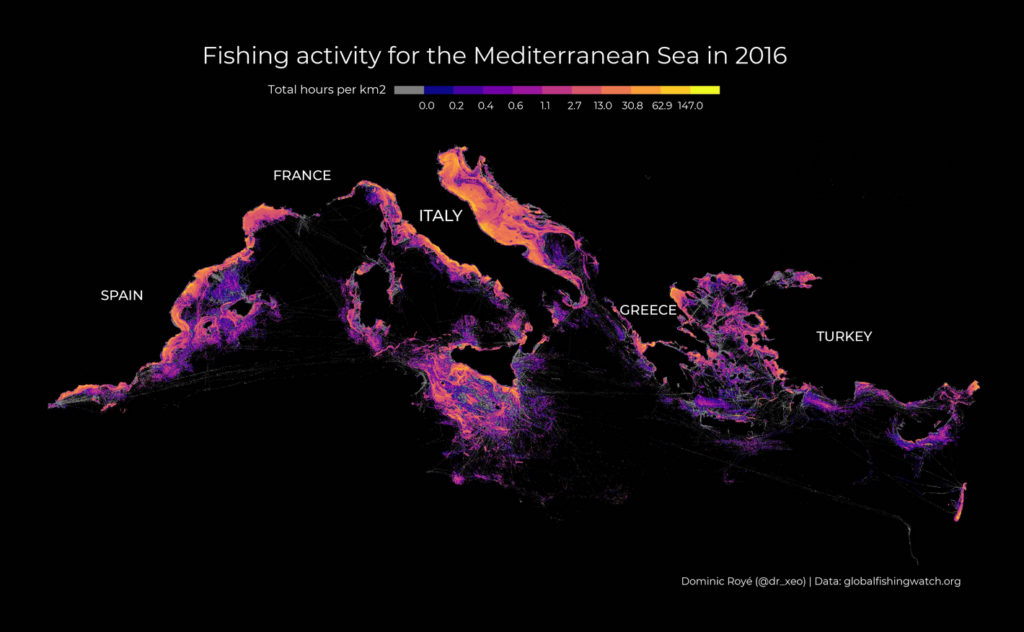
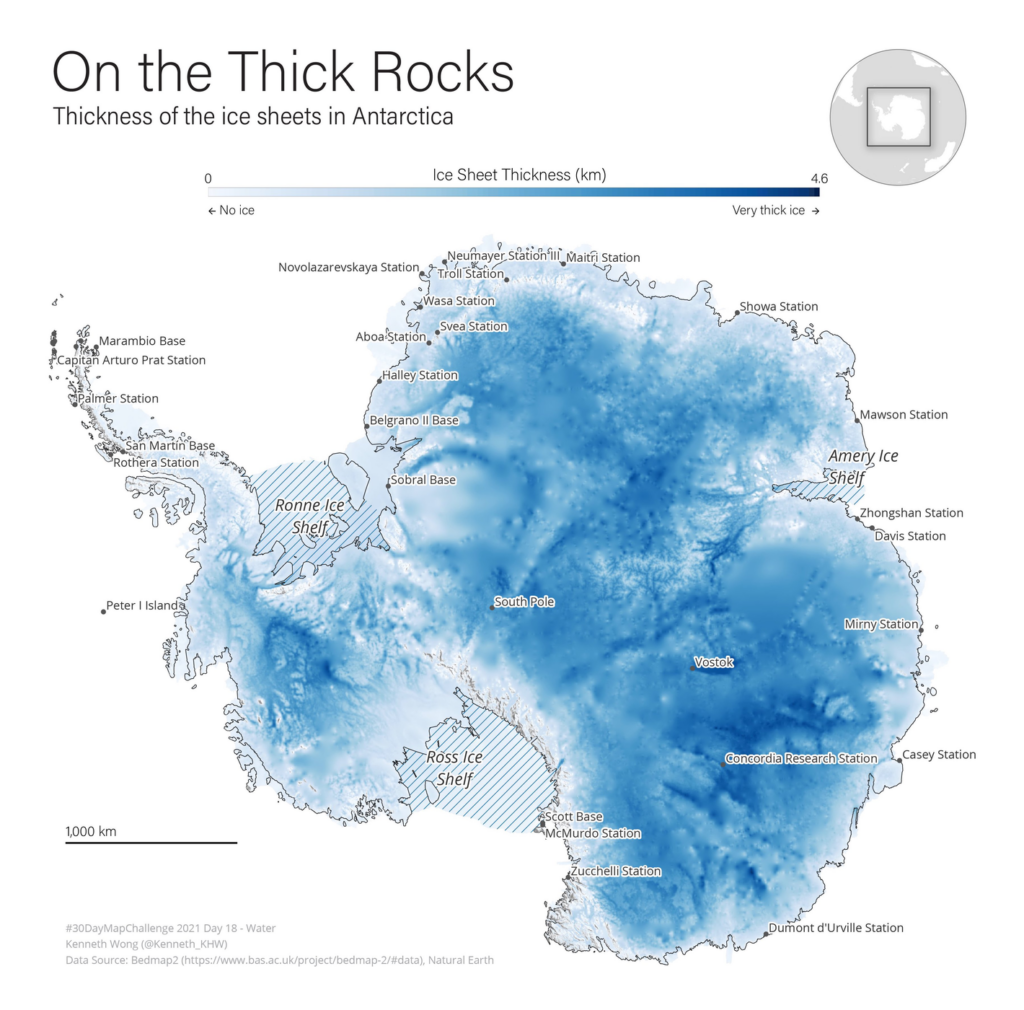
November’s #30daymapchallenge continued this week with the theme “water”:

@researchremora: “Day 18, #30DayMapChallenge: water! Here are two bathymetric maps of Lake Michigan. Couldn’t decide which one I liked more, the one with topography or the one without,” November 18 (Tweet)
Ewa Grabska-Szwagrzyk: “#30DayMapChallenge Day 18 – Water Meanders of Bug river in Poland – actual and former channel courses depicted using hillshade and elevation made in #QGIS with elevation data from @GUGiKgovpl,” November 18 (Tweet)
Dominic Royé: “#30DayMapChallenge 2021 Day 18 – Water Fishing activity,” November 18 (Tweet)
Kenneth Wong: “#30DayMapChallenge Day 18 – Water Thickness of ice sheets in Antarctica. Not until I searched for datasets of the antarctic did I realise how thick polar ice could be (It’s 4.6 km deep!),” November 18 (Tweet)

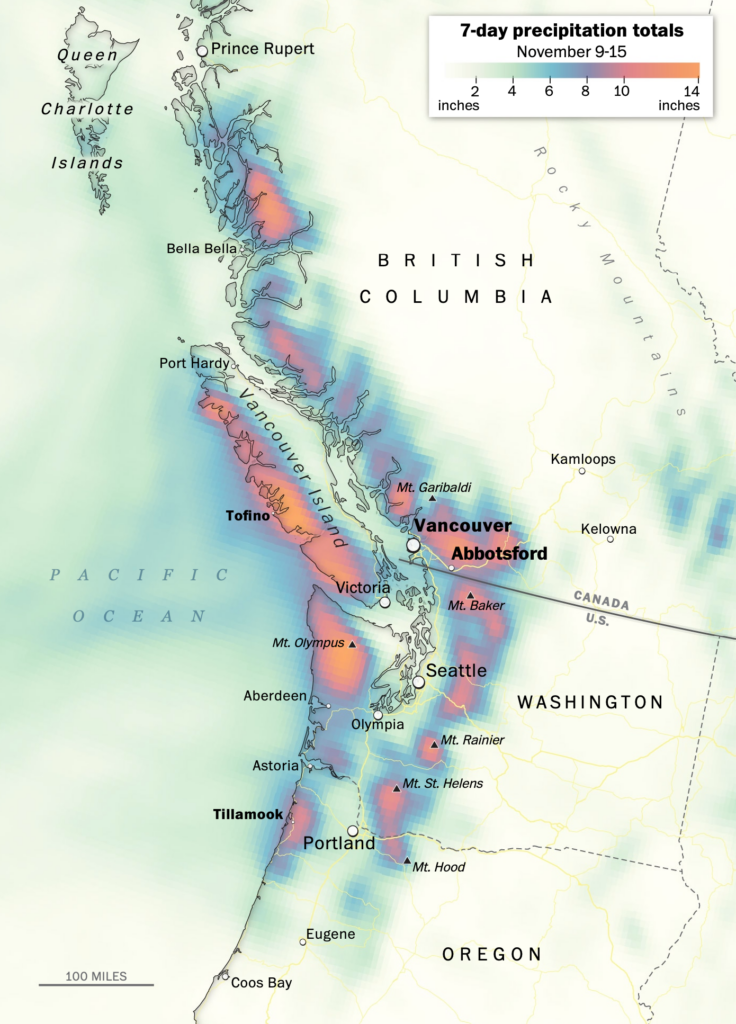
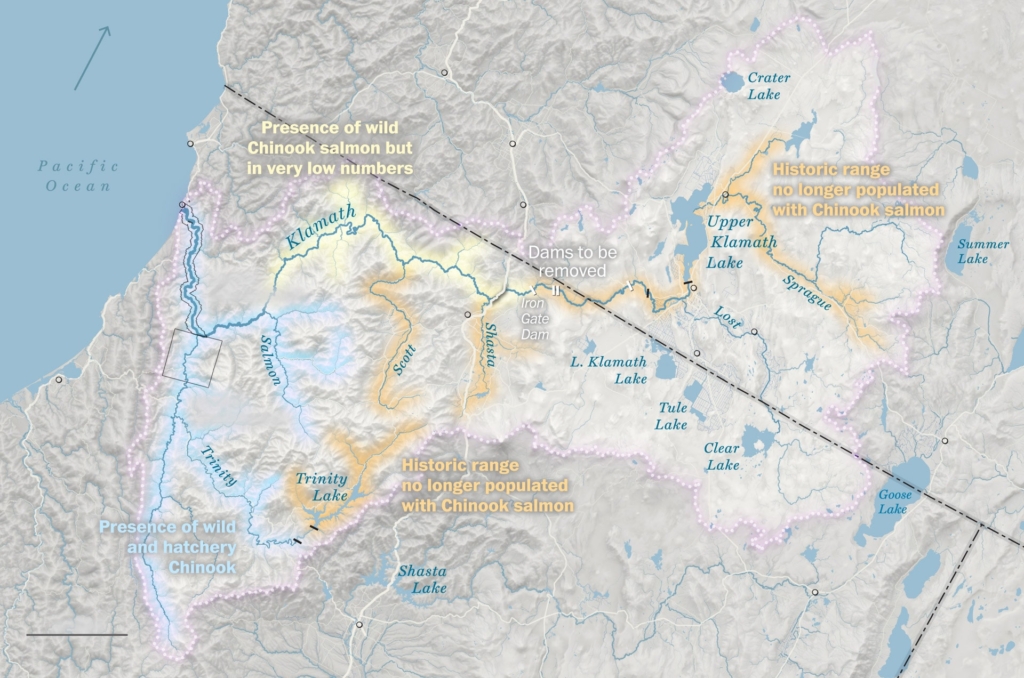
The Washington Post got in on the water maps action too:

The Washington Post: First fires, now floods: British Columbia and Washington reeling from atmospheric river, November 18
The Washington Post: Climate change fuels a water rights conflict built on over a century of broken promises, November 22

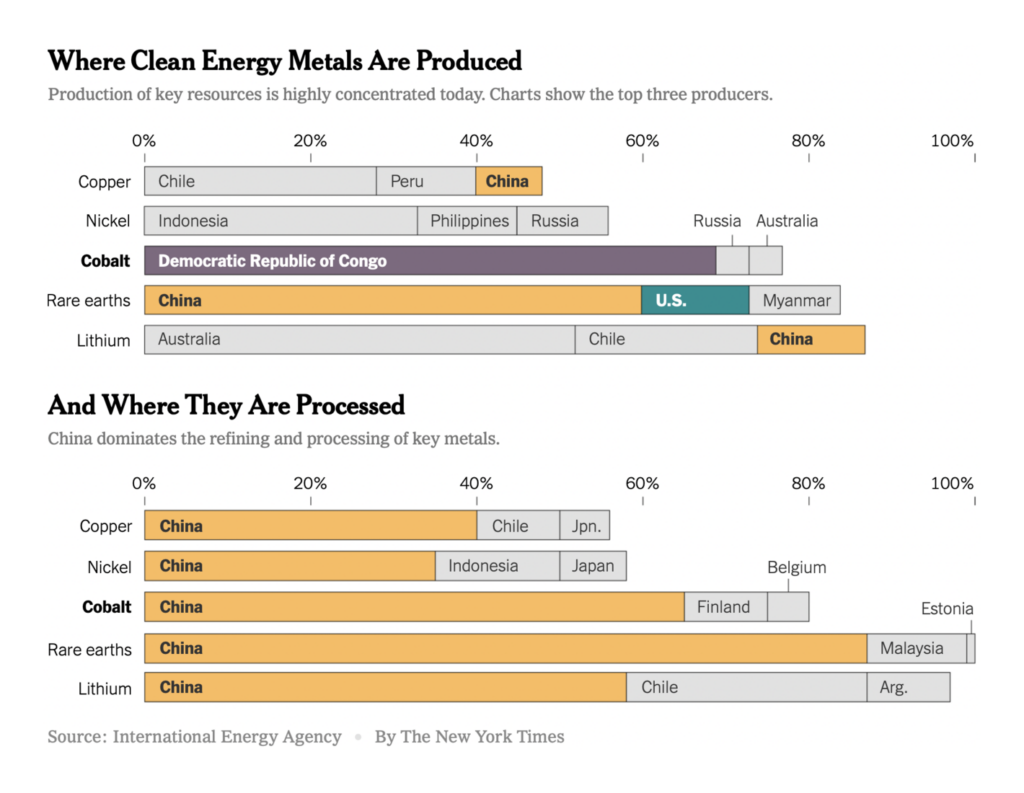
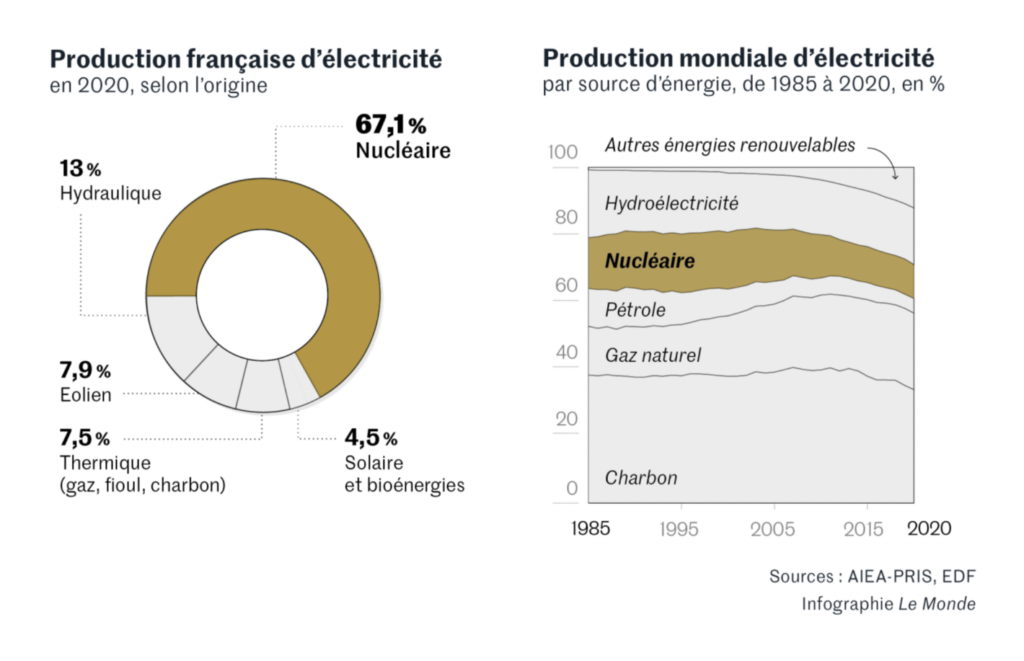
Clean energy was major topic this week:

The New York Times: A Power Struggle Over Cobalt Rattles the Clean Energy Revolution, November 20
Financial Times: Big carmakers struggle to touch Tesla production forecasts, November 20
Le Monde: Coût, gestion des déchets et sécurité : huit questions que pose le retour annoncé du nucléaire en France, November 18

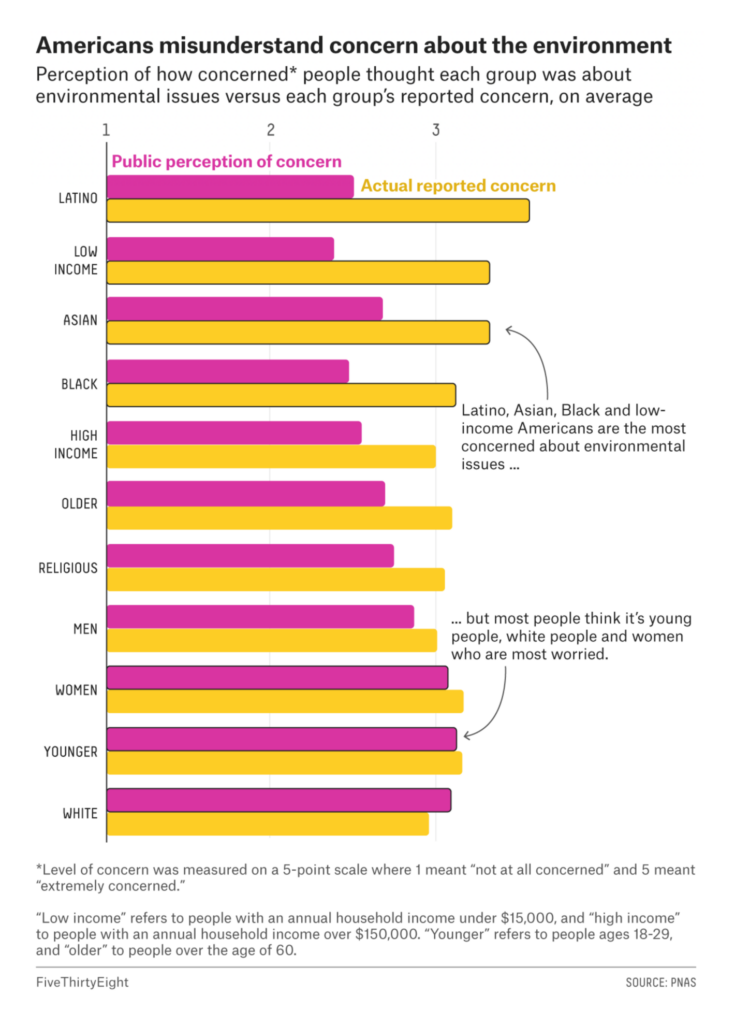
And we also got a reminder that environmental issues have a broader base than people think:

FiveThirtyEight: Why Many Americans Underestimate Who Is Most Concerned About The Environment, November 18

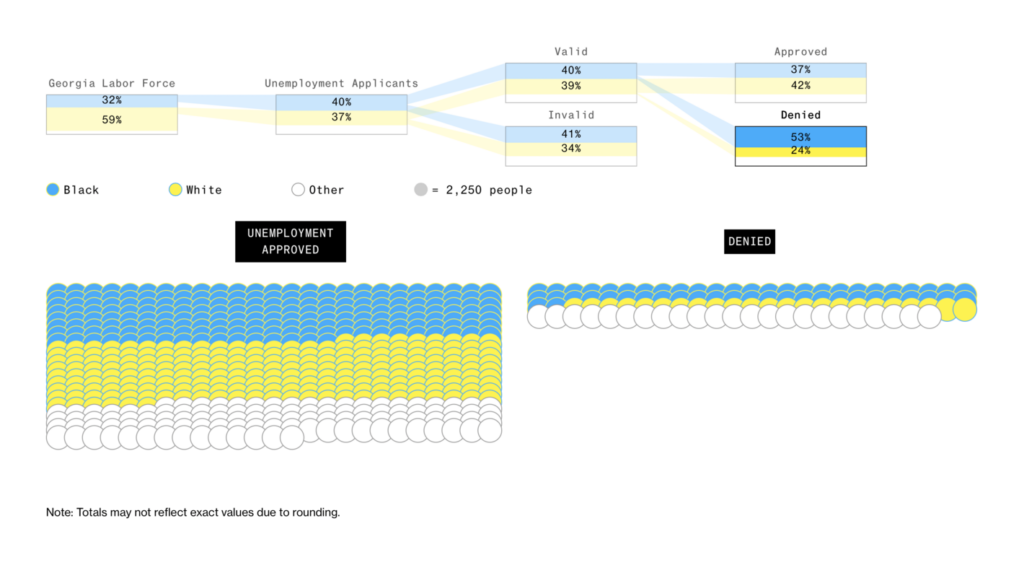
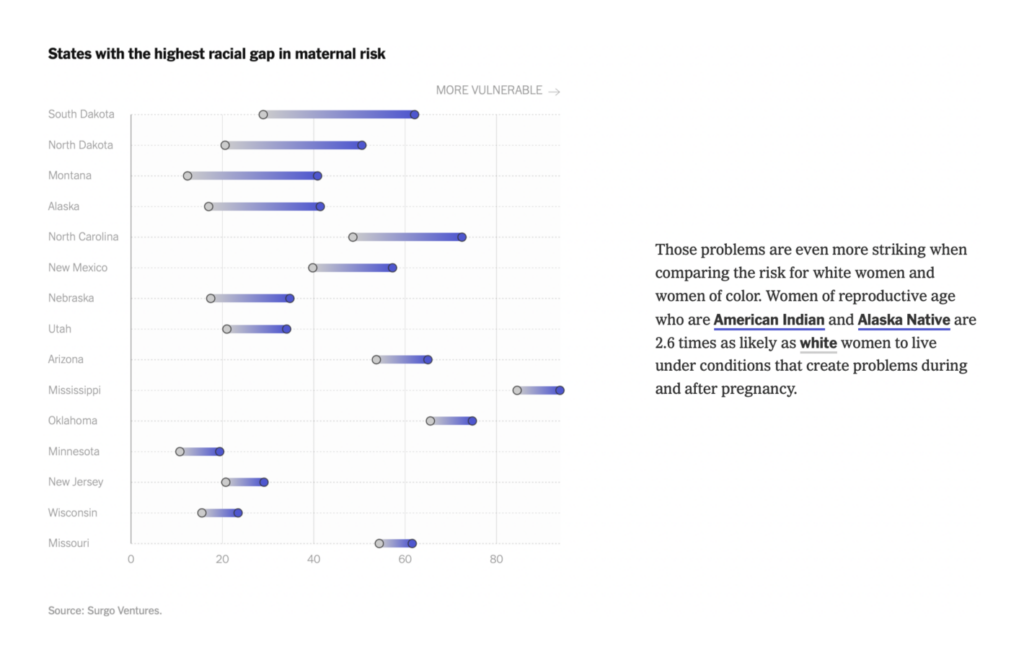
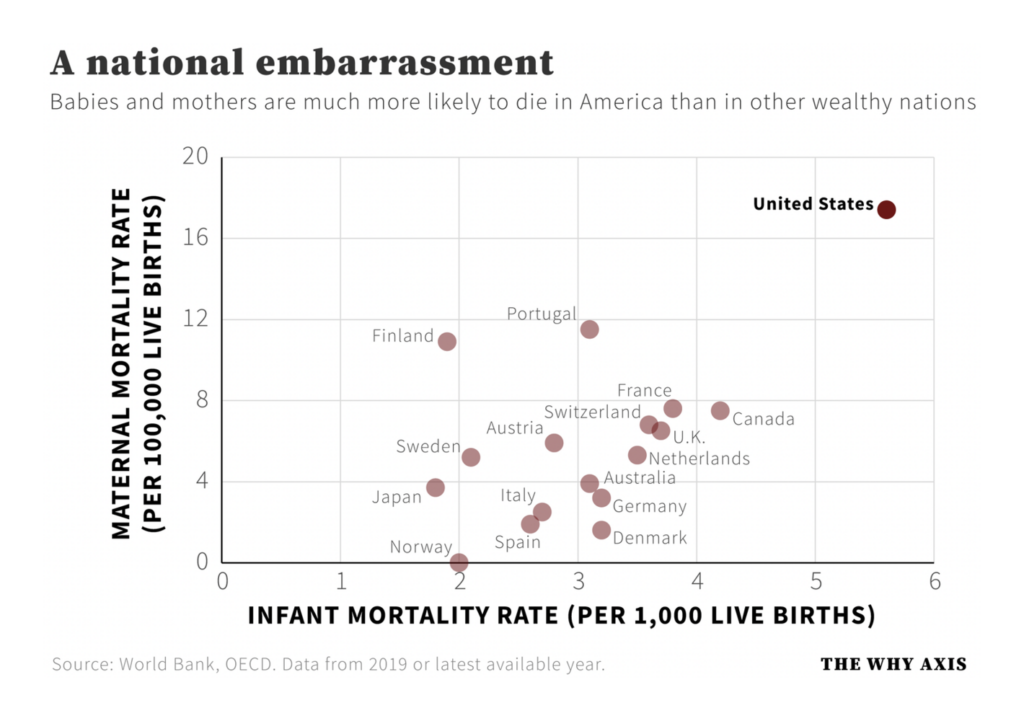
These charts put a spotlight on maternal mortality in the U.S.:

The New York Times: What We See in the Shameful Trends on U.S. Maternal Health, November 17
The Why Axis: Why there’s $50 million for doulas in Build Back Better, November 18

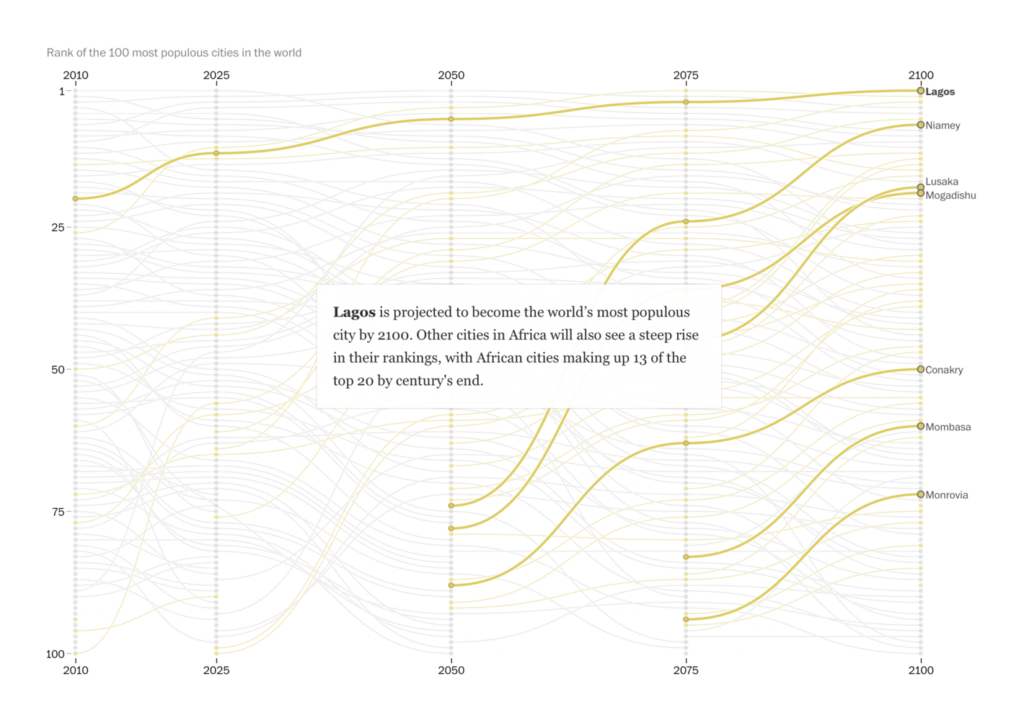
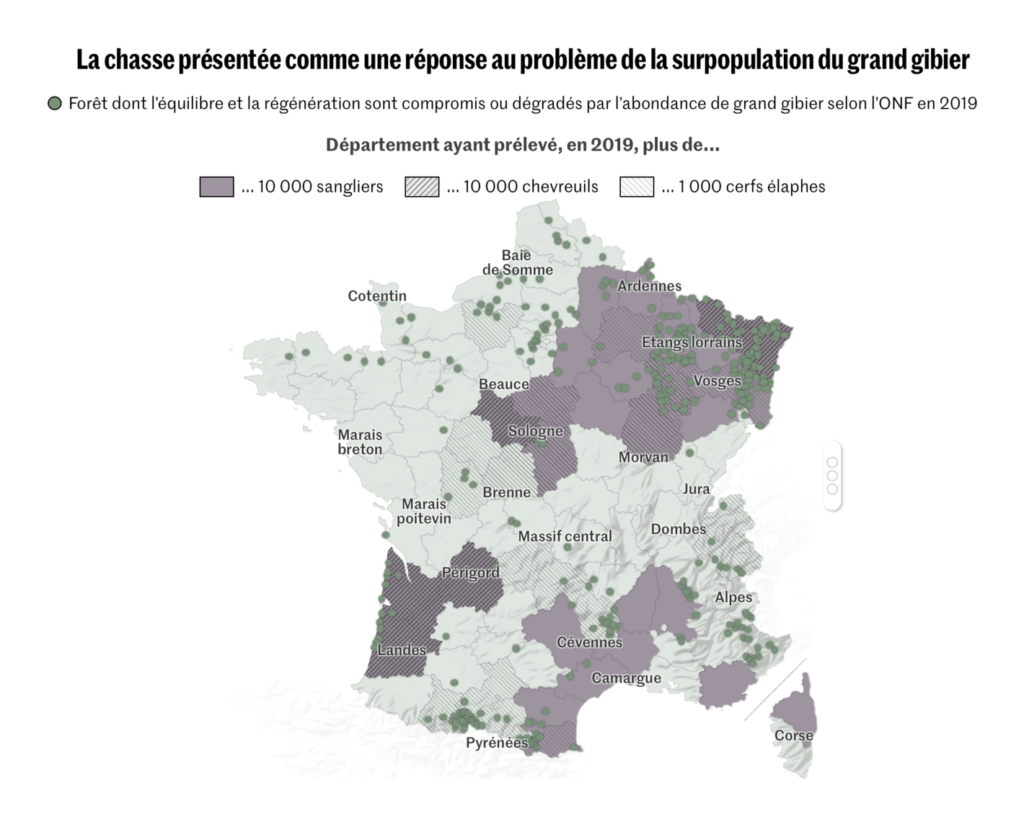
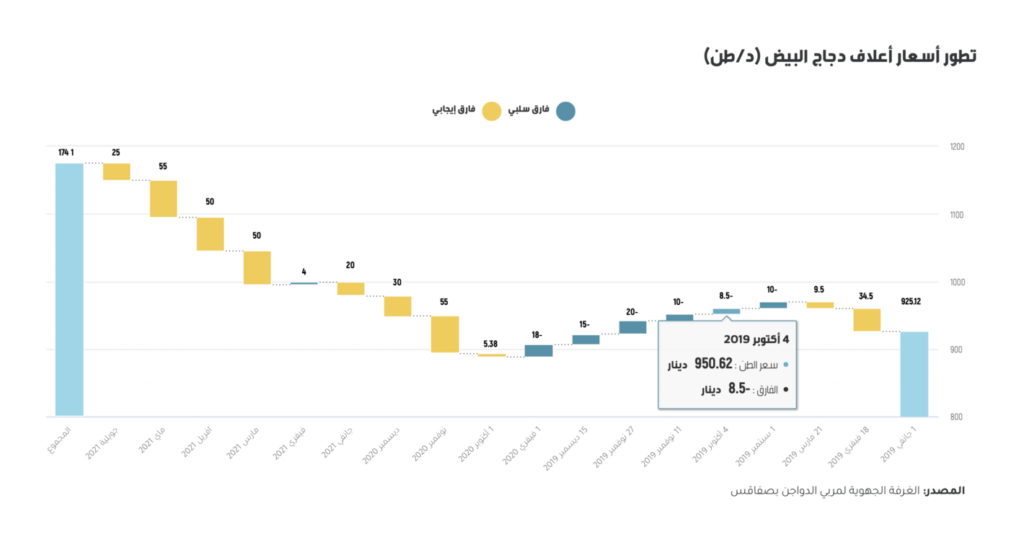
And other charts and maps covered everything from seven booming African cities, to the debate over hunting in France, to the price of chicken feed in Tunisia:

The Washington Post: Africa’s Rising Cities, November 19
El País: La nueva plaza de España, el corazón de ocho enclaves históricos de Madrid, November 21
El Confidencial: Las caras de Xavi: ídolo culé, ‘cruyffismo’, enemigo del Madrid y defensor de Qatar, November 20
El País: Dos meses de erupción en el volcán de La Palma, en cifras: 906 millones en daños, 5.100 terremotos, 7.000 proyectos de vida en punto muerto, November 19
Le Monde: Un quinquennat très attentif aux chasseurs, moins à la protection de la nature, November 16
Inkyfada: تربية الدواجن: أمام معاناة المربين الصغار إلى من تؤول الأرباح؟, November 16
Folha de S.Paulo: Questões do Enem na mira de Bolsonaro são eficientes em testar conhecimento, November 20
Bloomberg: Jack Dorsey’s Celebrity Network Is Helping Him Give Away Billions, November 21

What else we found interesting

The Washington Post: NASA hopes to hit an asteroid now in case we really need to knock one away later, November 21
Jason Forrest: “Why do I look through 1940’s Bureau of Agricultural Economics documents? To find the amazing hidden charts inside! These 4 charts by Philip C. Curtis from his time on the WPA are absolute gold! This pictorial statistic uses a scales metaphor in a way I’ve never seen before,” November 21 (Tweet)
The Guardian: Revealed: the software that studies your Facebook friends to predict who may commit a crime, November 17
Kontinentalist: The fight for food, November 18

Help us make this dispatch better! We’d love to hear which newsletters, blogs, or social media accounts we need to follow to learn about interesting projects, especially from less-covered parts of the world (Asia, South America, Africa). Write us at hello@datawrapper.de or leave a comment below.

Comments