Data Vis Dispatch,
November 30

The best of last week’s big and small data visualizations

Welcome back to the 24th edition of Data Vis Dispatch! Every week, we’ll be publishing a collection of the best small and large data visualizations we find, especially from news organizations — to celebrate data journalism, data visualization, simple charts, elaborate maps, and their creators.

Recurring topics this week include increasing COVID cases in Europe and the new Omicron variant, visualizations on air pollution, and some last, beautiful #30DayMapChallenge maps.

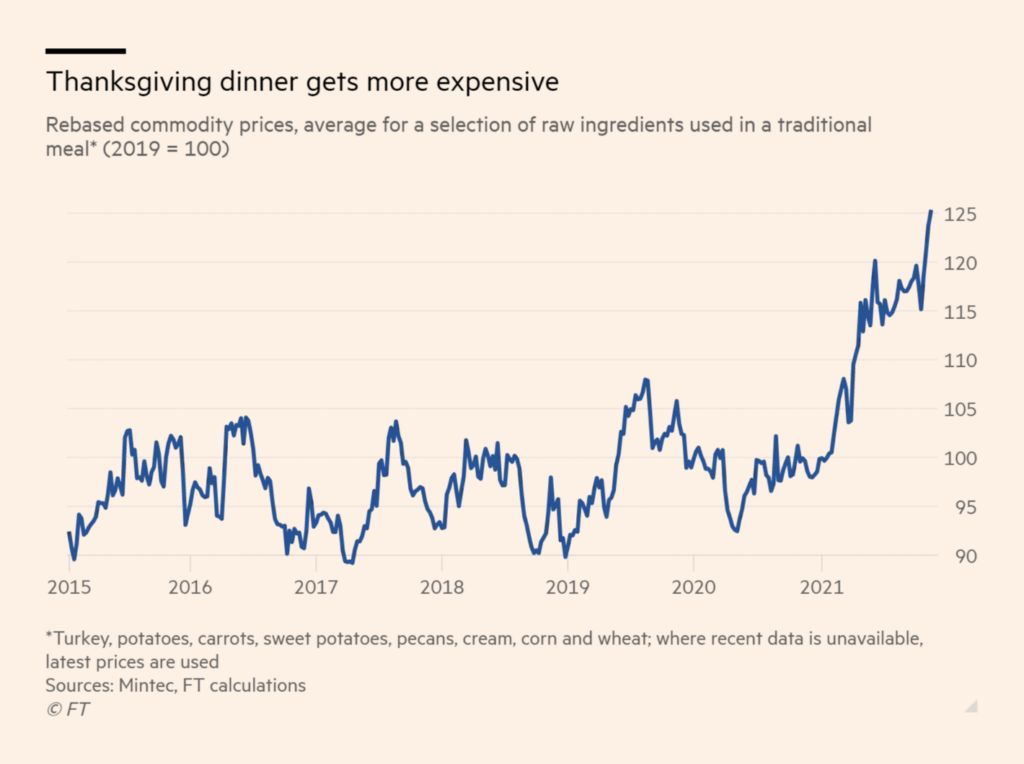
First, something nice. Last week, lots of you celebrated Thanksgiving — and as Vox reminds us, there is lots to be thankful for. (As Michelle Rial reminds us, after eating lots of good food, dishes need to be done:)

Michelle Rial: “Happy Thanksgiving!!!,” November 25 (Tweet)
Financial Times: Thanksgiving feasts return in force but at a more expensive price, November 24

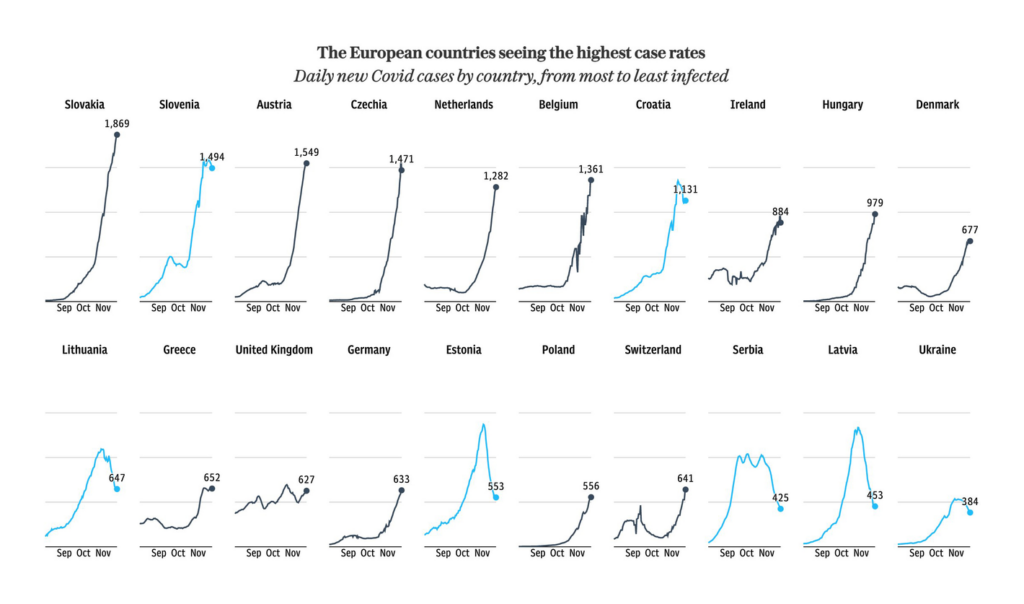
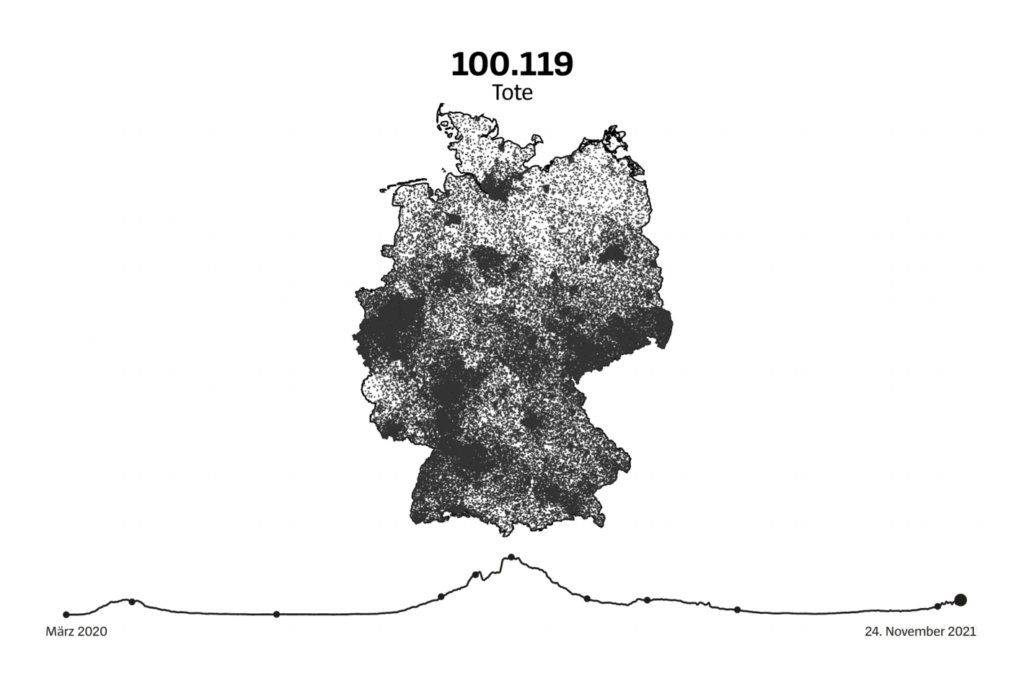
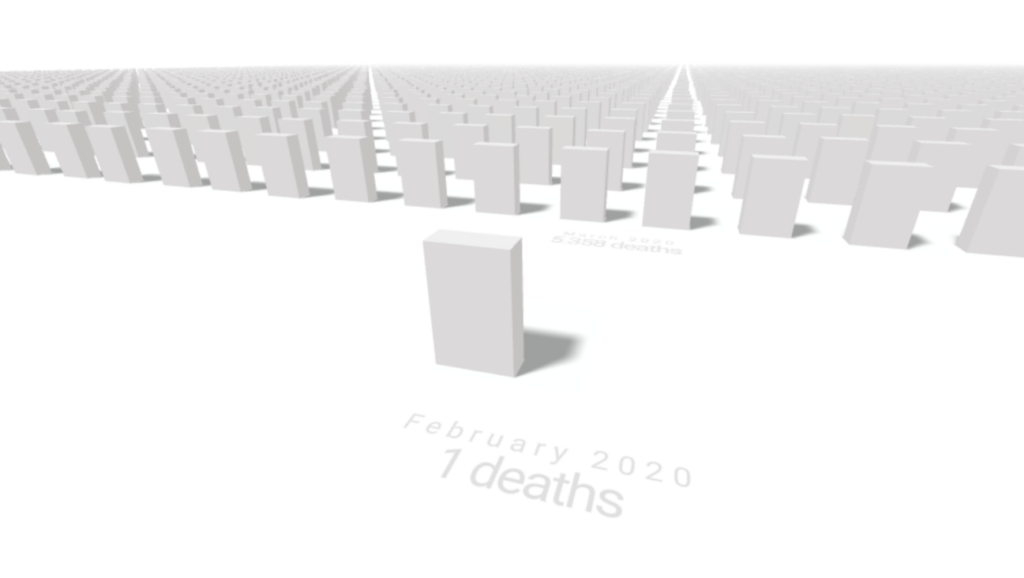
Now, the less pleasant news: Covid cases and hospitalizations in Europe have been rising. Here in Germany, cases are higher than ever. According to official numbers, by now more than 100,000 people have died of COVID-19 in Germany, as SPIEGEL and Moritz Klack show strikingly:

The Telegraph: In charts: The European countries racing to vaccinate amid rising Covid cases and lockdowns, November 24
El País: ¿Cómo es la nueva ola europea de contagios que ya impacta en España?, November 29
SPIEGEL: 100.000 Coronatote in Deutschland – Die wir verloren haben, November 25
Moritz Klack: Coronavirus Cemetery, November 23 (Tweet)

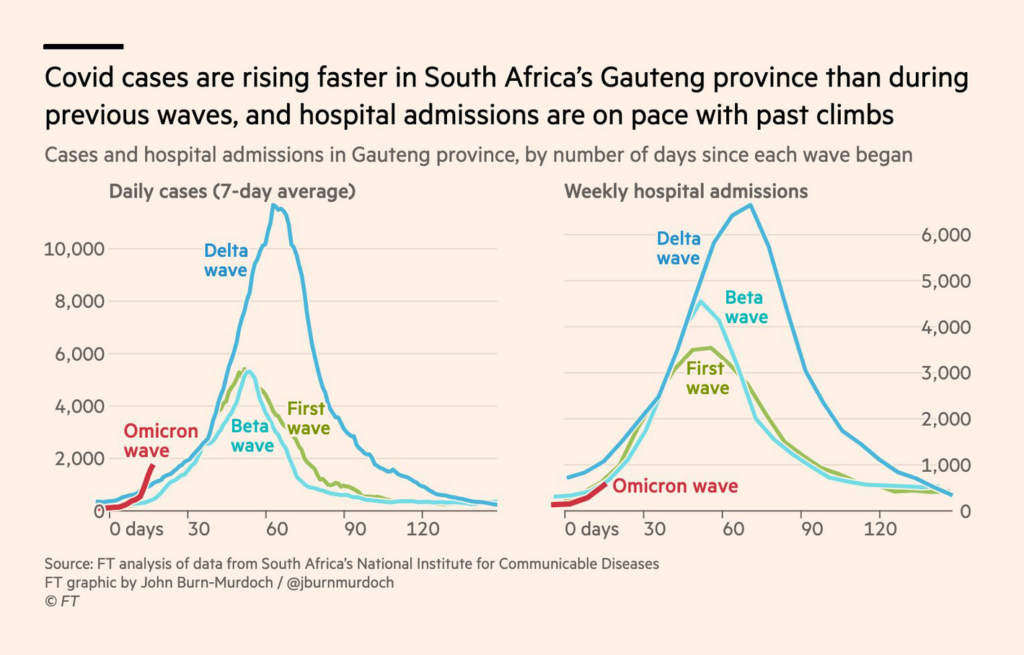
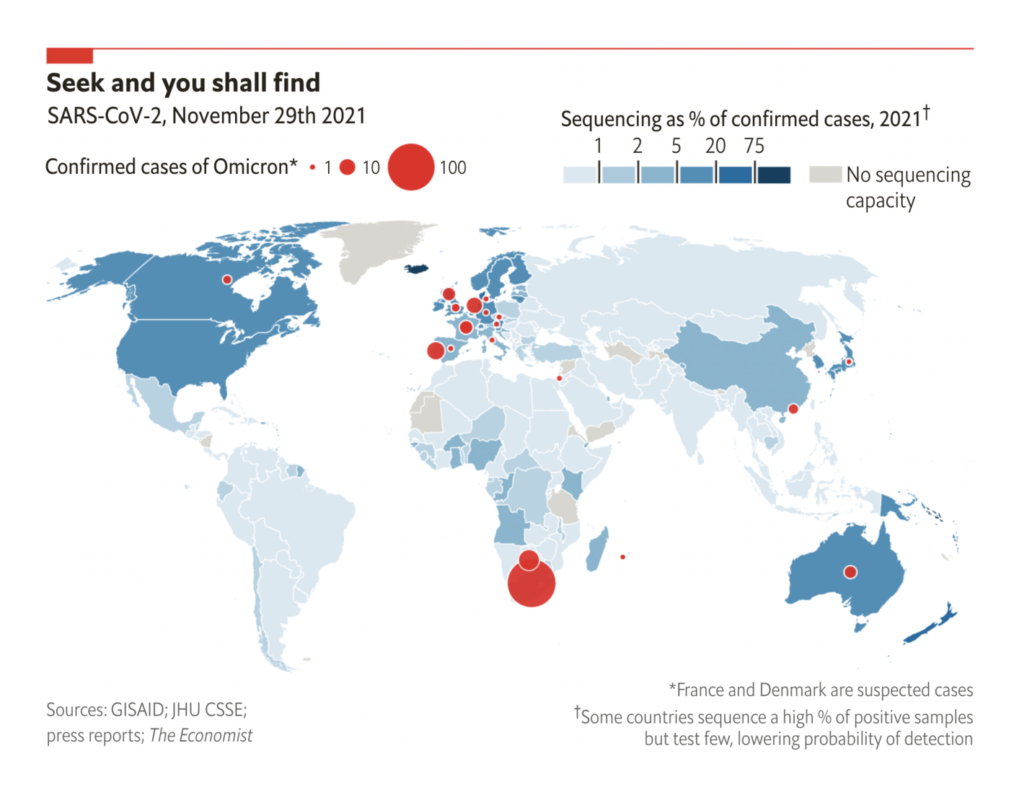
What’s more: After Delta, there’s a new SARS-CoV-2 variant called Omicron. The Financial Times reported about it five days ago when it was still called B.1.1.529:

Financial Times: ‘The virus is always searching for its next move’: why science is alert to new variants, November 25
Financial Times: ‘The world is watching South Africa’: health experts sift Omicron clues, November 30
The Economist: Omicron is starting to spread around the world, November 29

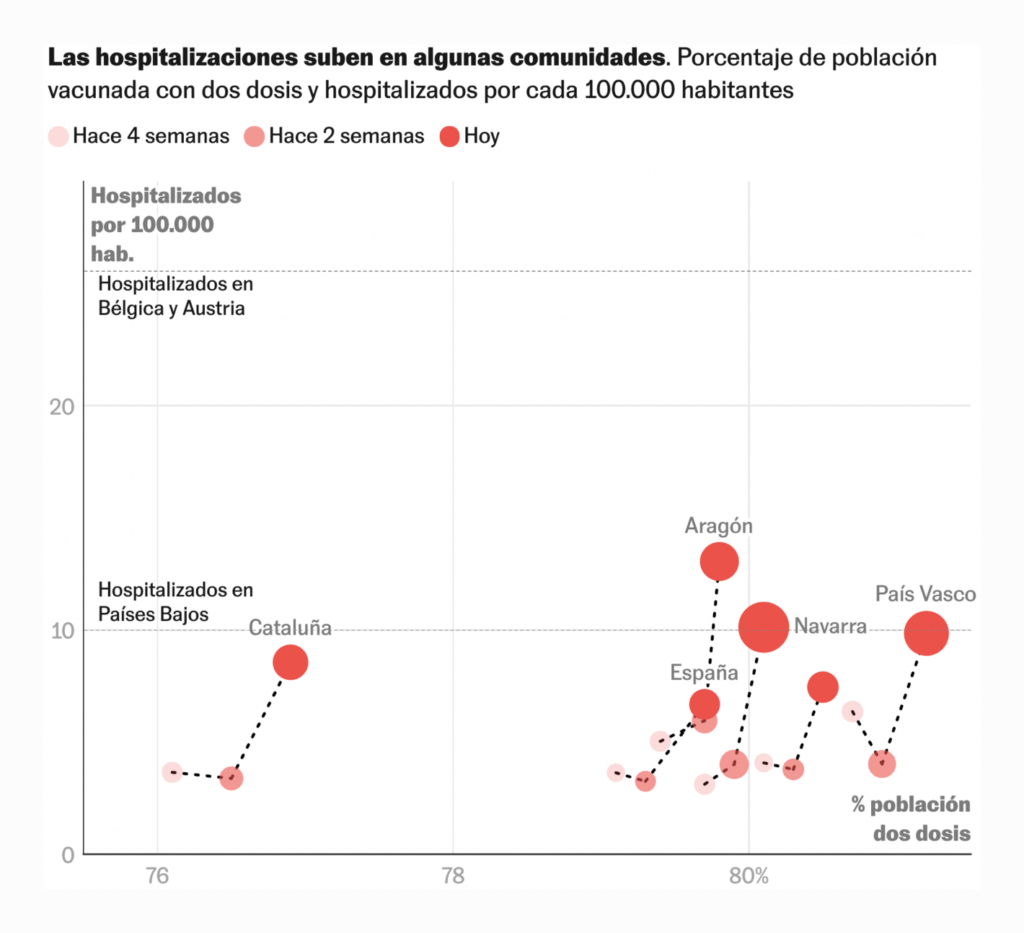
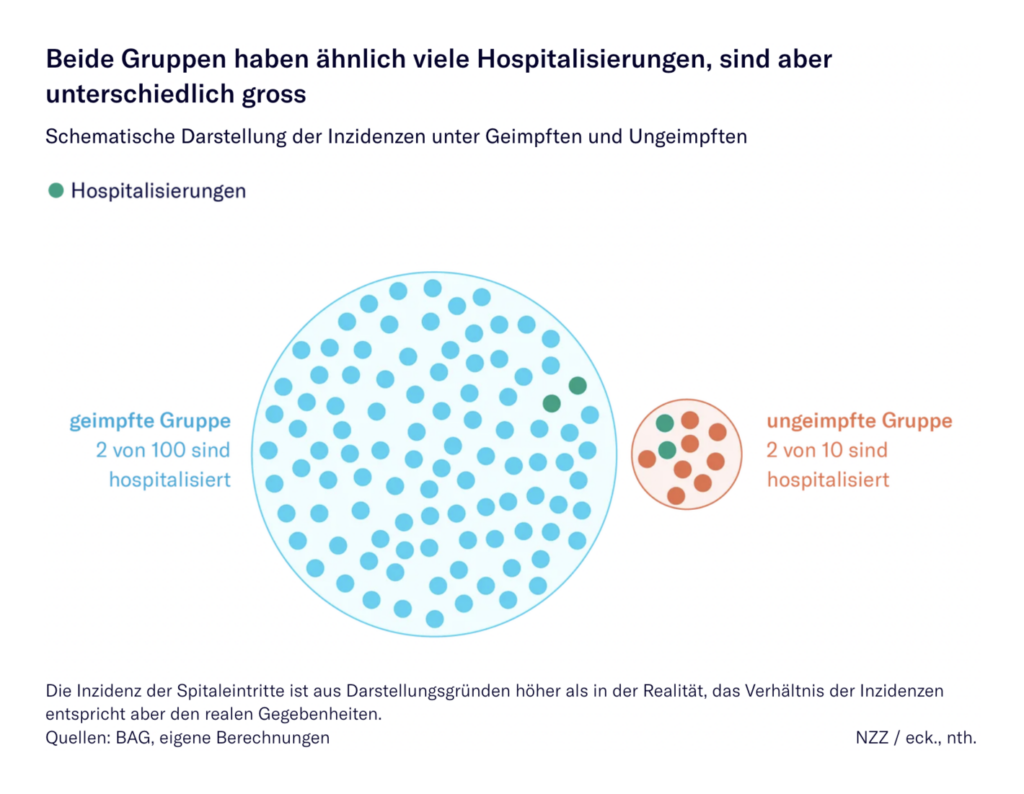
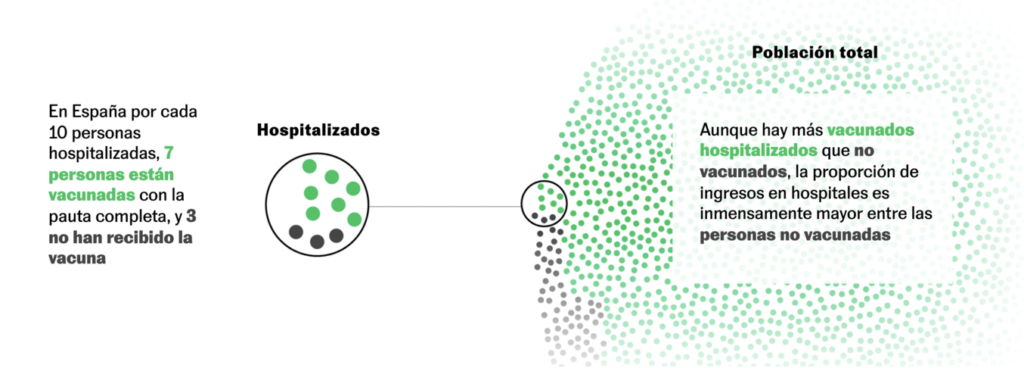
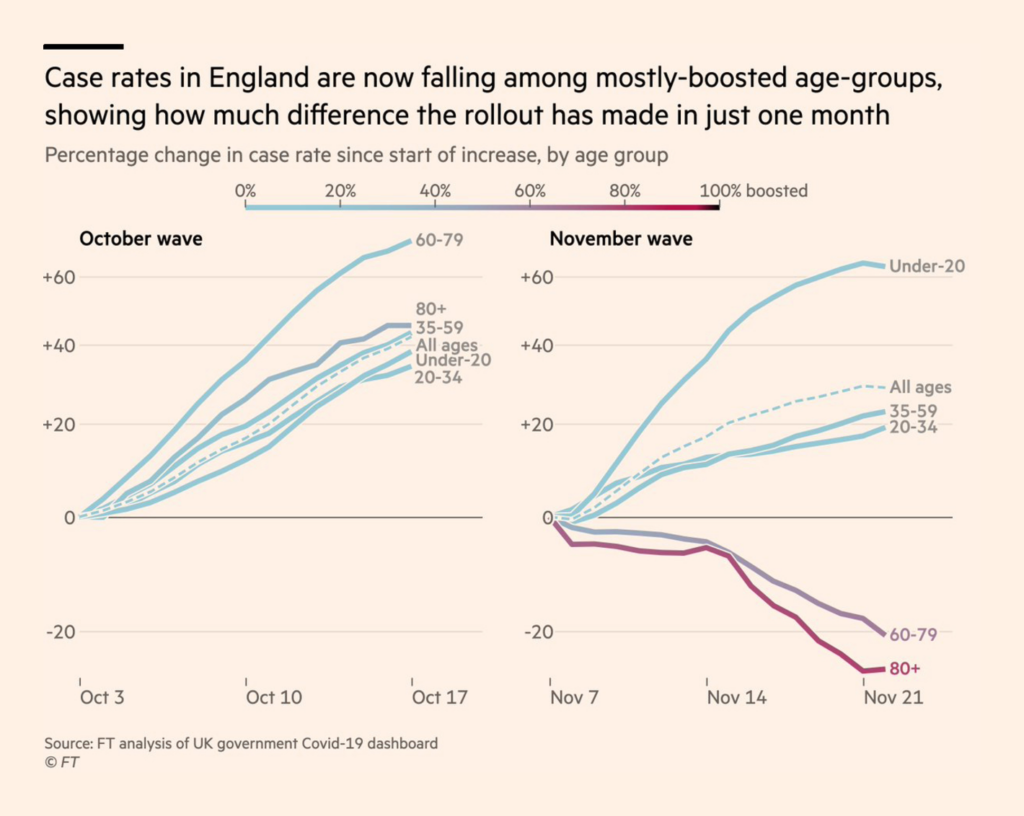
But vaccines still work — and hopefully will also do so against Omicron — as many newspapers keep showing. Likely inspired by Mark Rummy‘s popular Venn diagram, the graphics reporters at the Neue Zürcher Zeitung and El País both use circles and dots to explain why there are as many or even more vaccinated people hospitalized as unvaccinated:

Neue Zürcher Zeitung: Unter den Covid-19-Patienten sind viele geimpft. Warum die Impfung trotzdem wirkt, November 23
El País: Dos gráficos que ilustran la eficacia de las vacunas contra el coronavirus, November 24

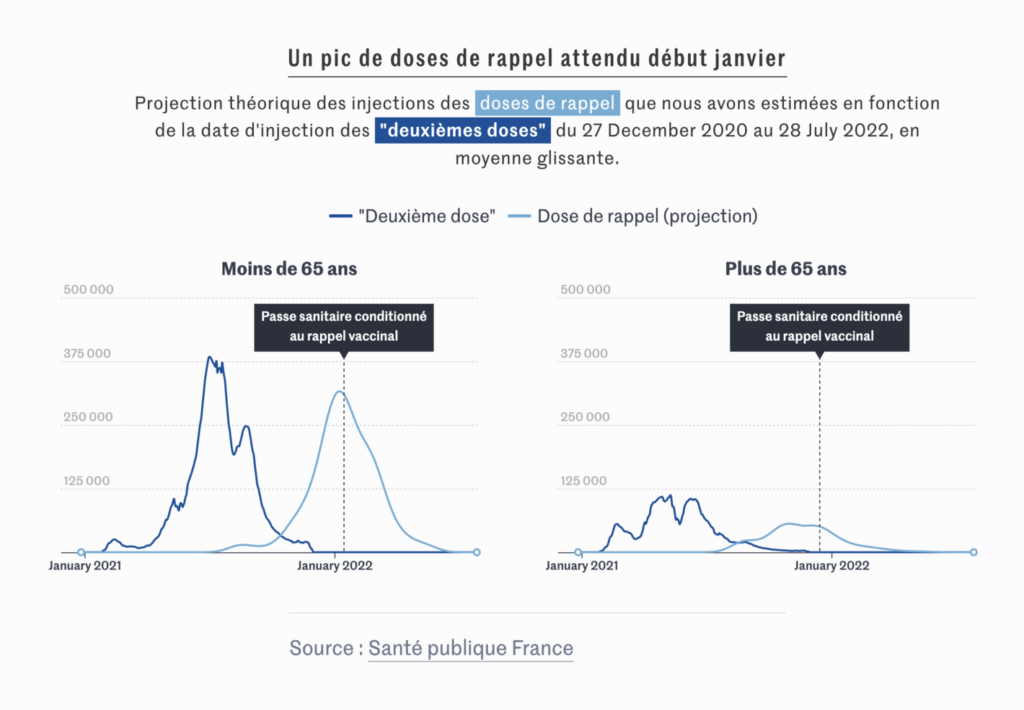
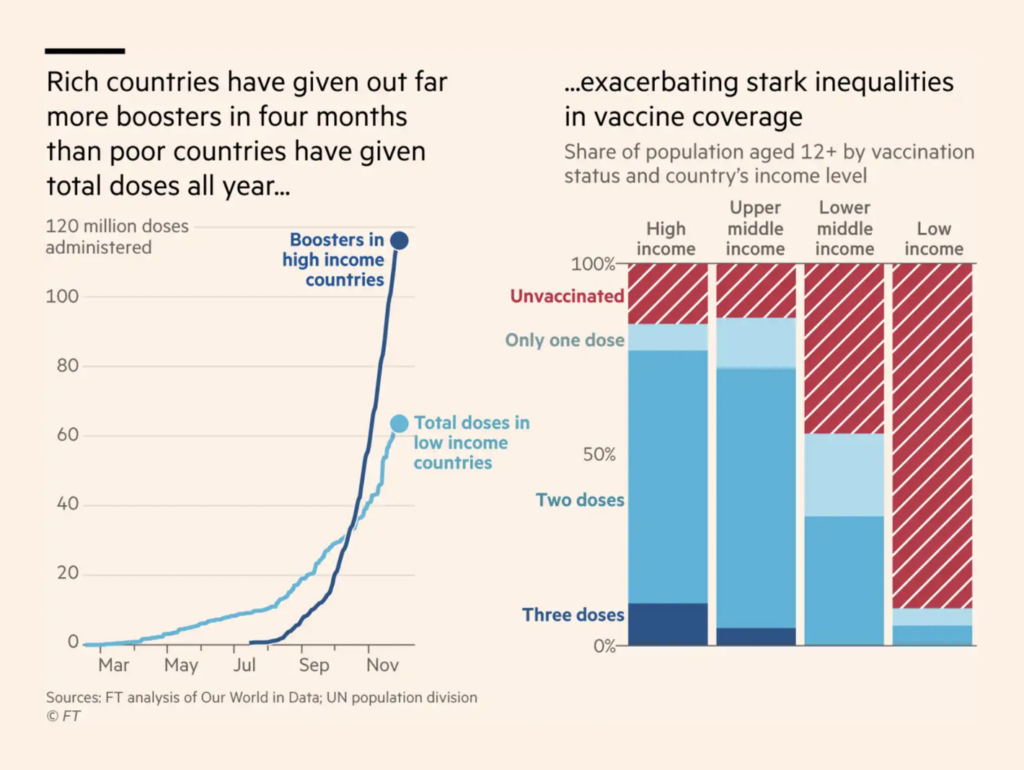
Graphics journalists also show that more and more people in Western countries are getting a third COVID vaccine, while most people in low-income countries haven’t had any:

Financial Times: UK boosted by third-jab success as infections surge in much of Europe, November 24 (John Burn-Murdoch: “This is a new chart format I’ve been working on for a few days. Lines still show age-groups, but they now change colour as people get boosters. In October booster coverage was still low even in elderly. But by late Nov you can clearly see how boosters drive cases down” – Tweet)
Le Monde: Vaccination contre le Covid-19 : le pic des doses de rappel en France devrait avoir lieu en janvier, November 26
Financial Times: The inside story of the Pfizer vaccine: ‘a once-in-an-epoch windfall’, November 30
Vijdan Mohammad Kawoosa for Reuters: “A quick look at the state of Covid-19 vaccinations makes it quite evident that low-income countries are lagging behind others by a wide margin. Only 5% of people in low-income countries have received at least one dose of a vaccine compared with 73% in high-income countries,” November 27 (Tweet)

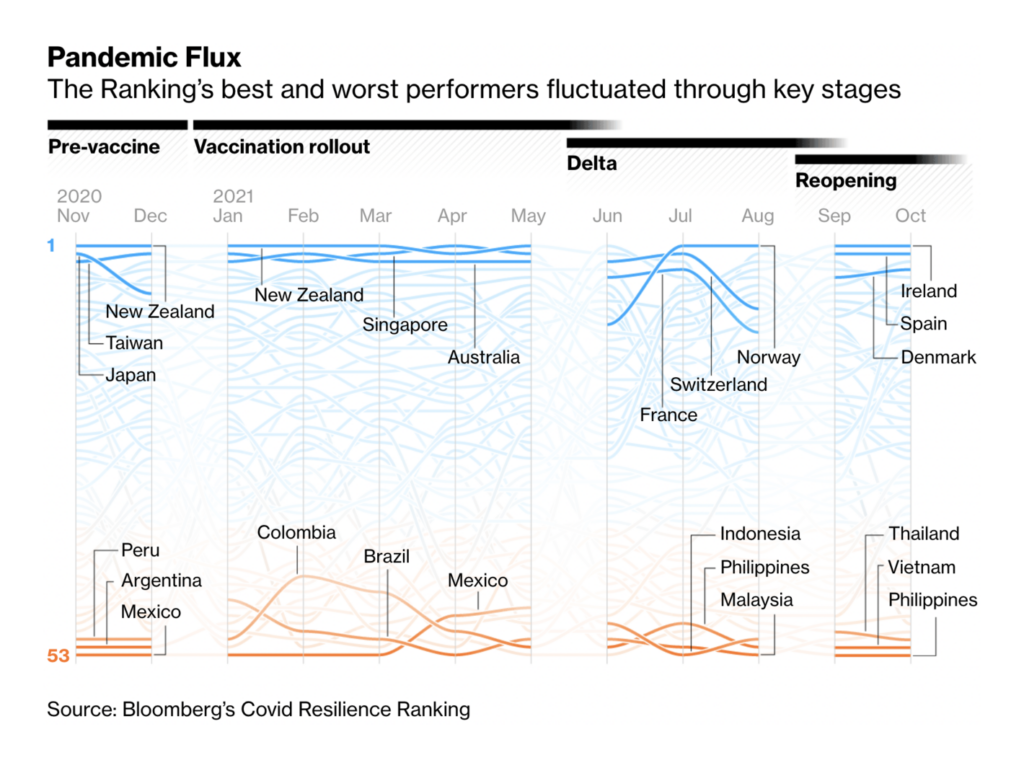
How did and how should societies, economies, and governments react? Like in so many weeks before, journalists try to find answers:

Bloomberg: The Winners and Losers From a Year of Ranking Covid Resilience, November 24
The Economist: Social distan-sting: Just like modern humans, honeybees avoid each other amid plagues, November 27
Neue Zürcher Zeitung: Die Österreicher sitzen im Lockdown, die Schweizer shoppen munter weiter – die Wirtschaftsentwicklung in Echtzeit, November 25

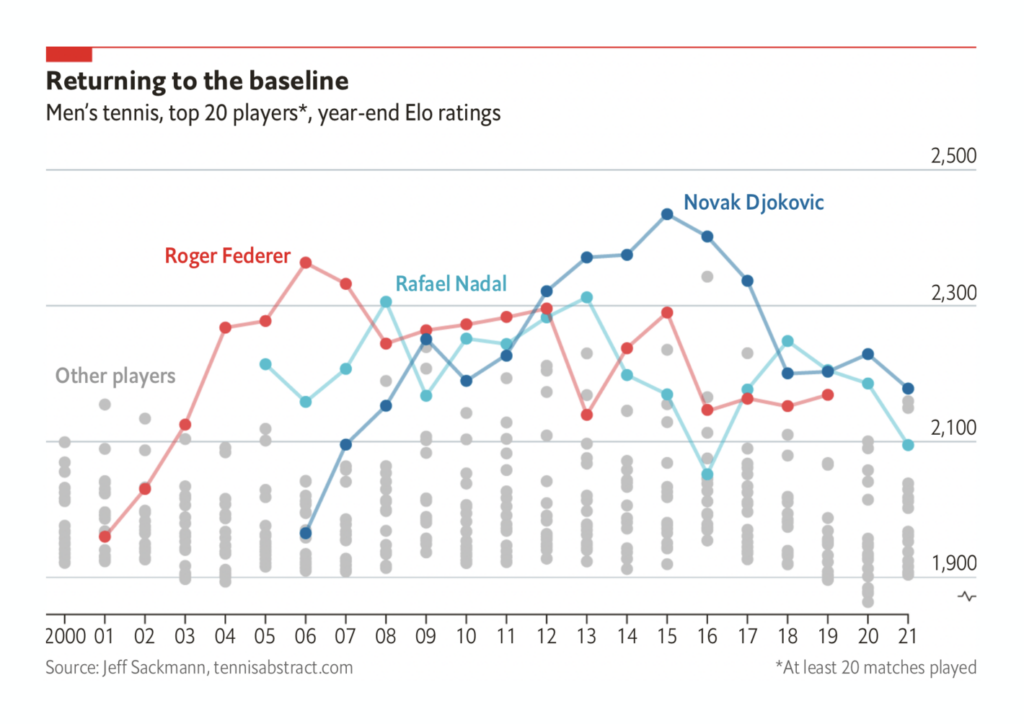
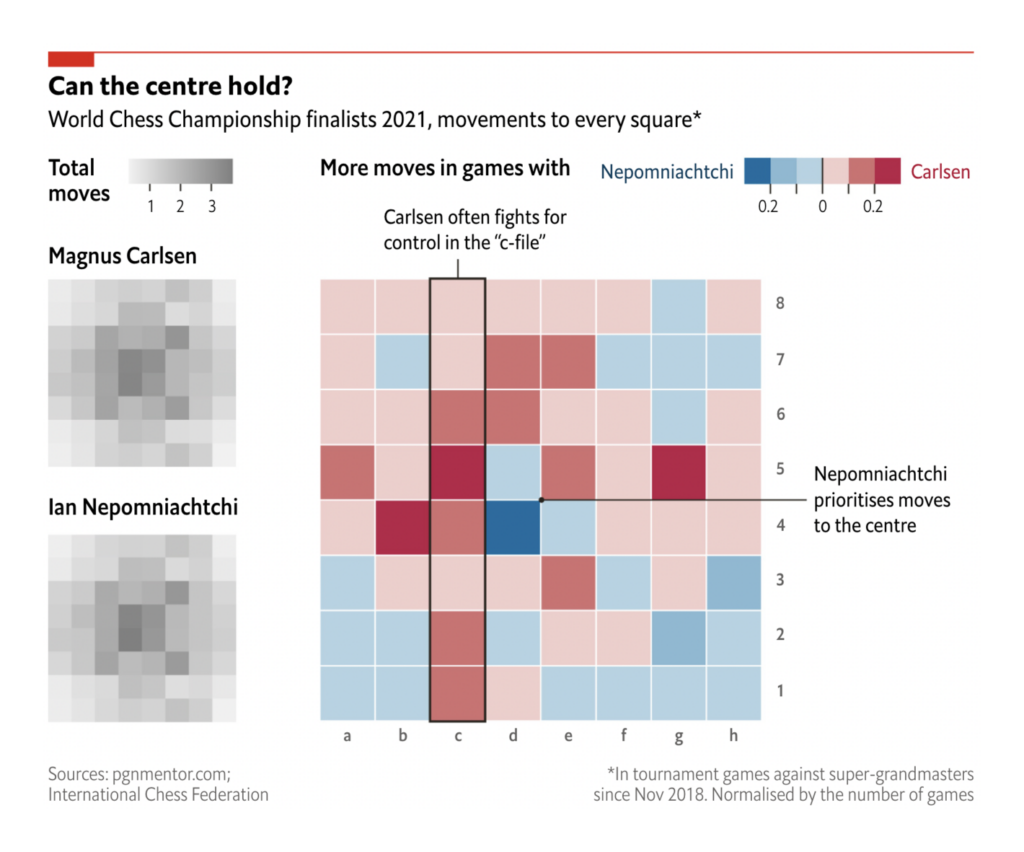
Let’s switch topics and look at what’s happening in sports. The 2021 FIFA Arab Cup starts today, and Al Jazeera shows data about teams and players with beautiful colors and shapes:

Al Jazeera: Visualising the 2021 FIFA Arab Cup, November 25
The Economist: Is this the beginning of a new era for men’s tennis?, November 23
The Economist: Who will win the World Chess Championship?, November 26

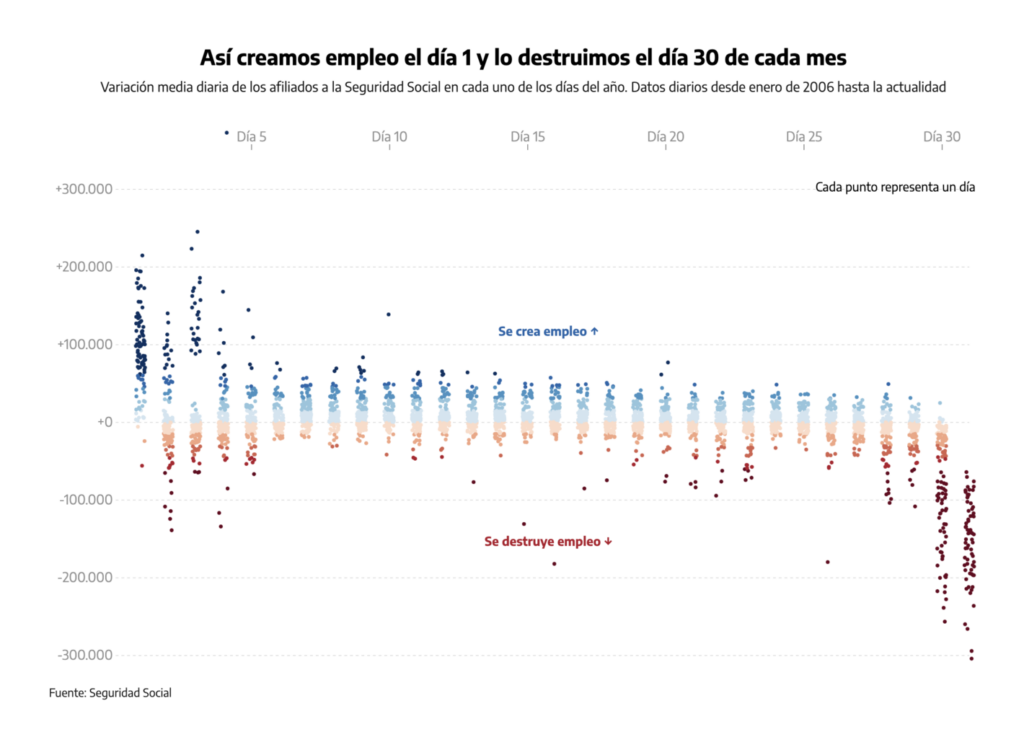
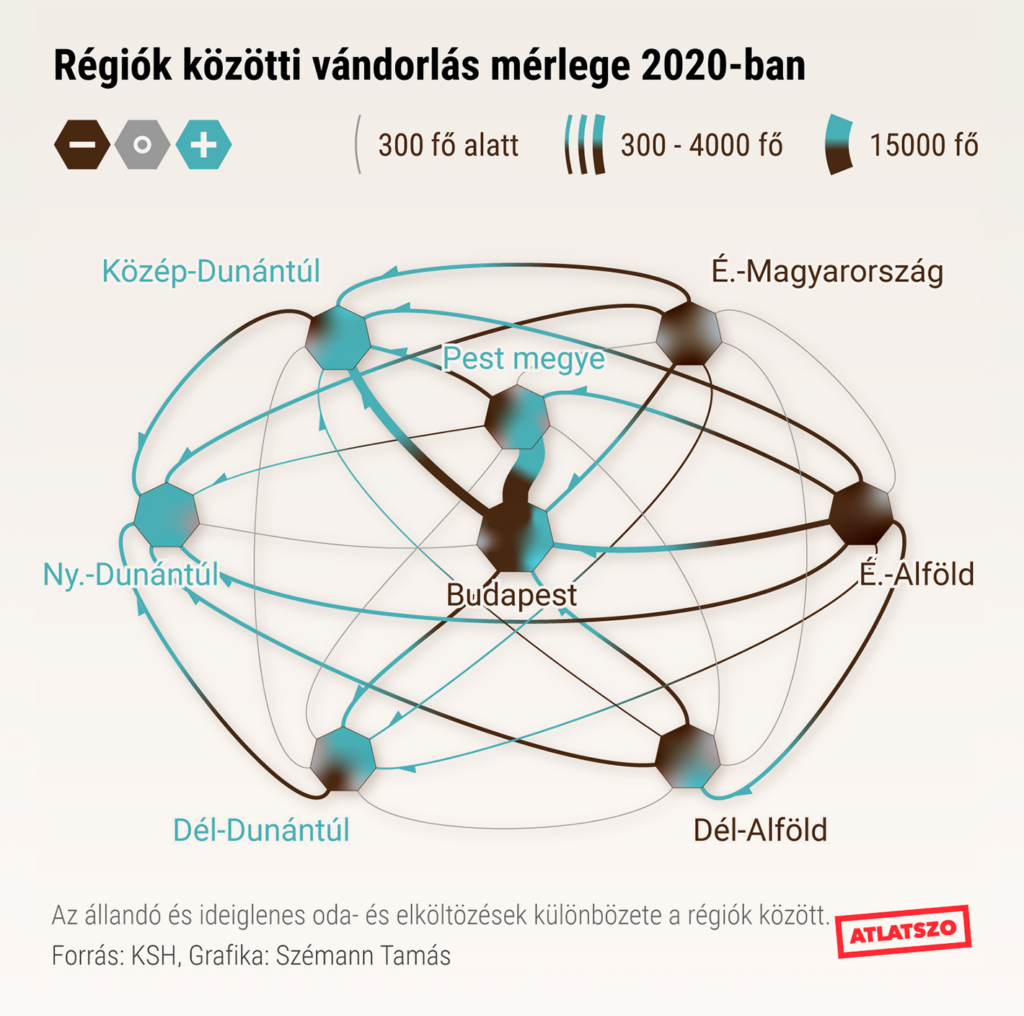
In politics, elDiaro uncovers the “frenetic creation and destruction of thousands of jobs every day” in Spain, while Hungarian news outlet Átlátszó shows how people in Hungary move from the east to the west:

elDiario.es: La España temporal: una máquina que crea y destruye 100.000 empleos al día, November 27
Átlátszó: Belföldi vándorlás 2020-ban: egyre nyugatabbra, November 25
Bloomberg: China Cash Flowed Through Congo Bank to Former President’s Cronies, November 28

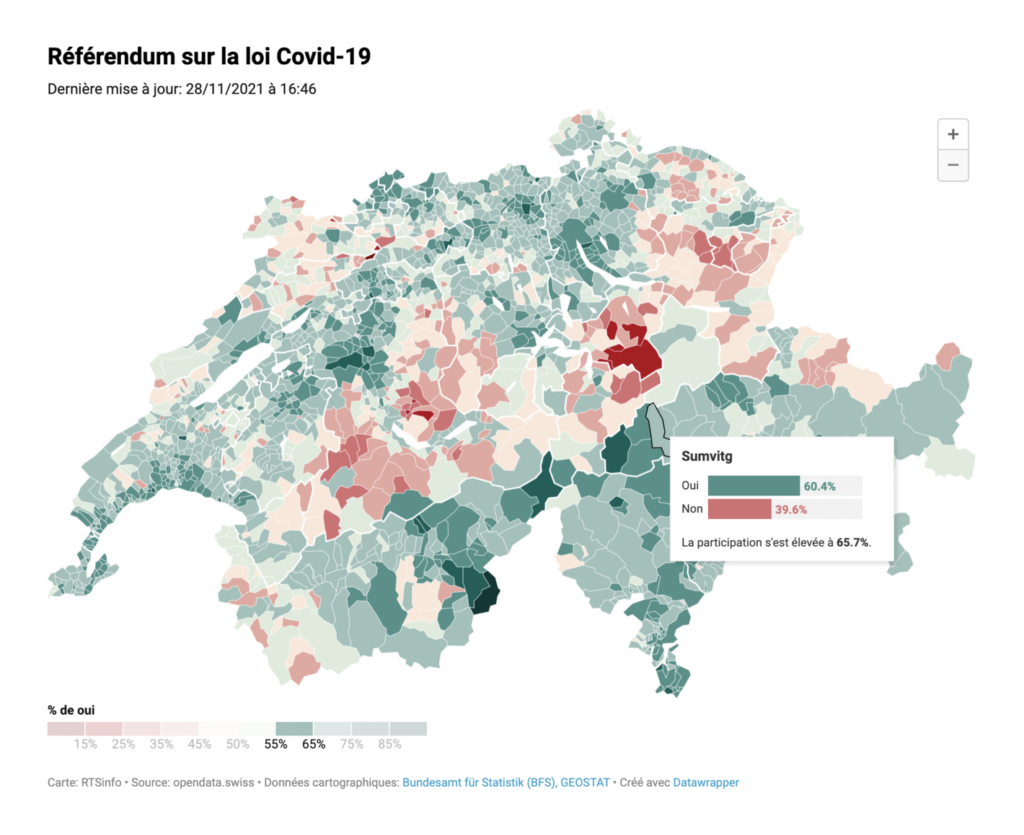
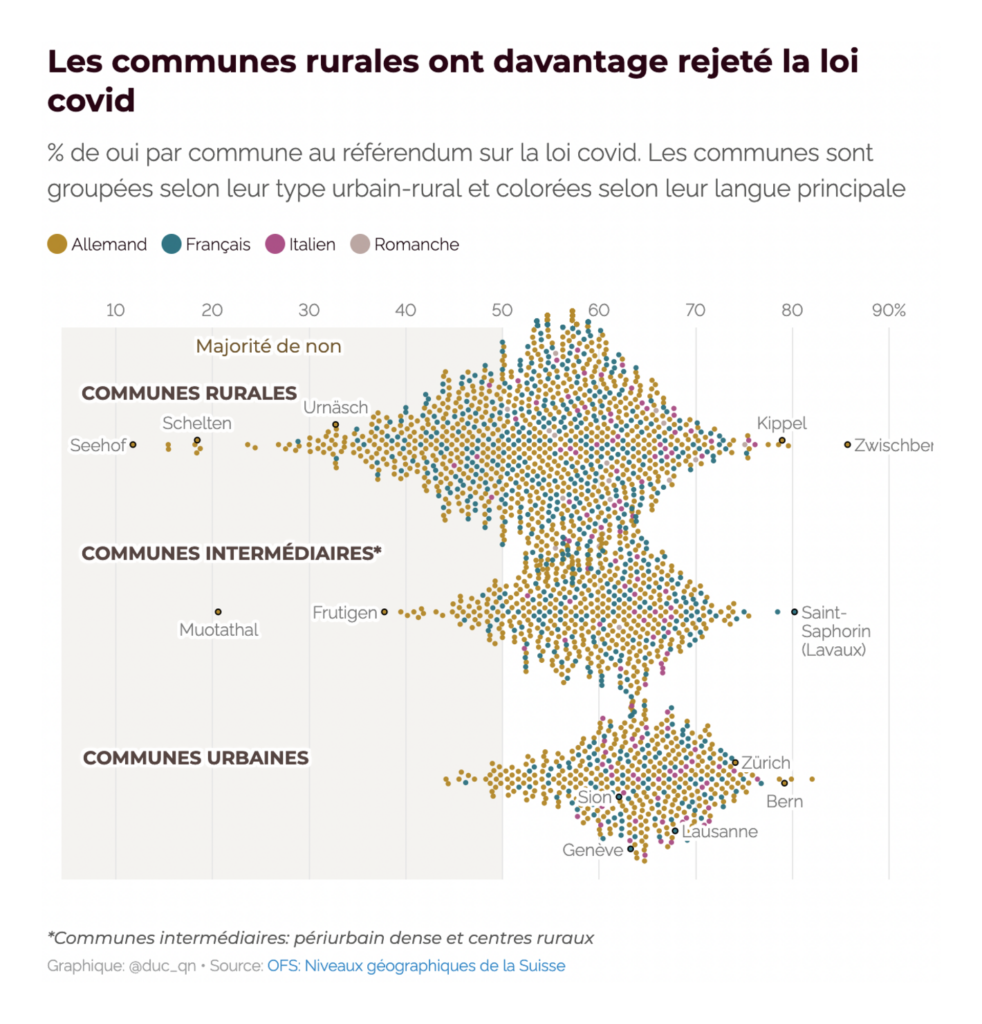
And Swiss news sites reported about the referendum that backed the government’s COVID policy:

RTS: Les cartes des résultats des votations fédérales, commune par commune, November 29
Duc-Quang Nguyen: “My #dataviz nerd victory of the day, create an interactive beeswarm chart using my two favorite tools #rstats & @datawrapper. Compute the beeswarm with R and pass it to datawrapper as a scatter plot: datawrapper.dwcdn.net/4h8eN/7/,” November 29 (Tweet)

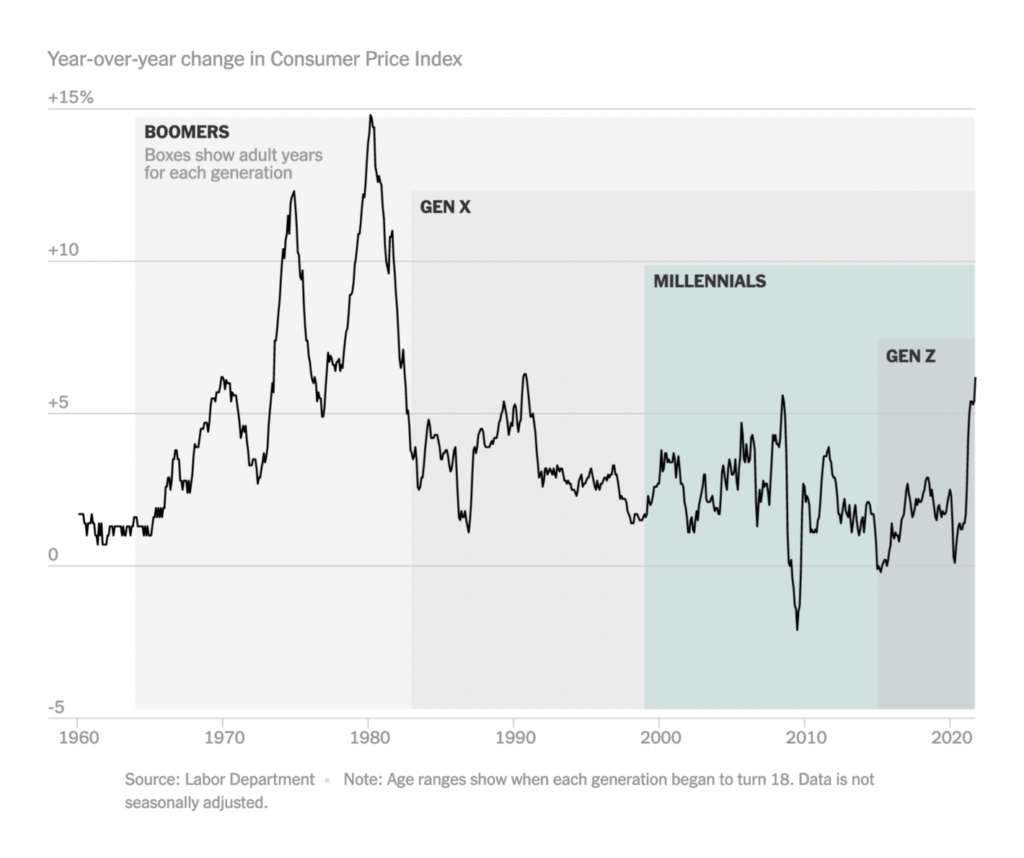
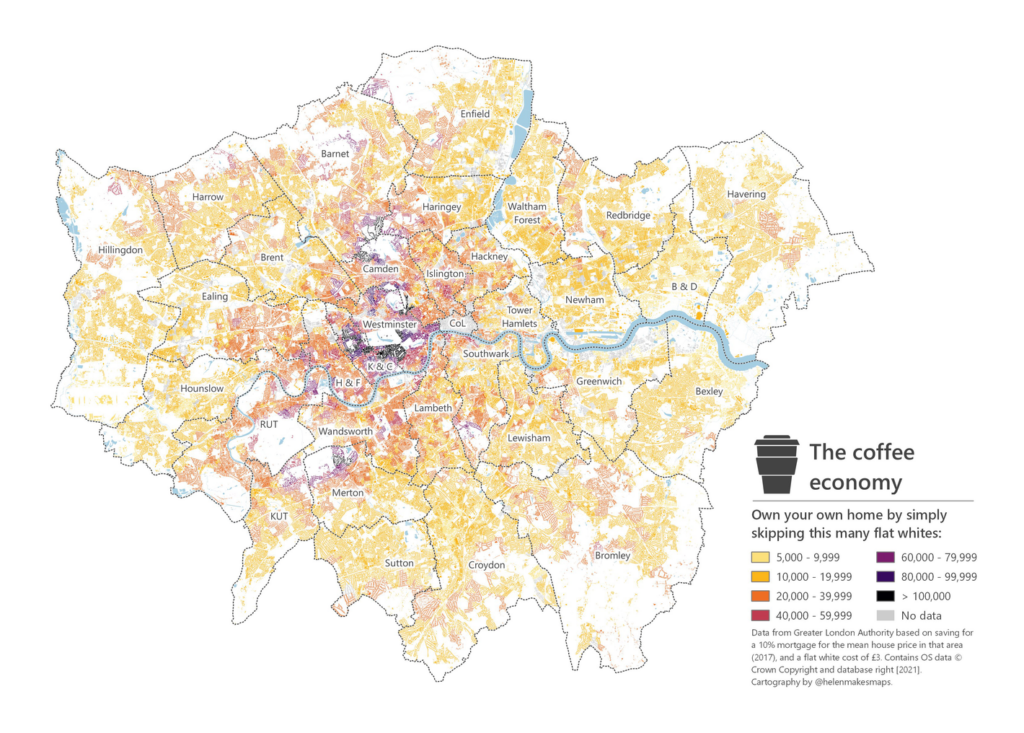
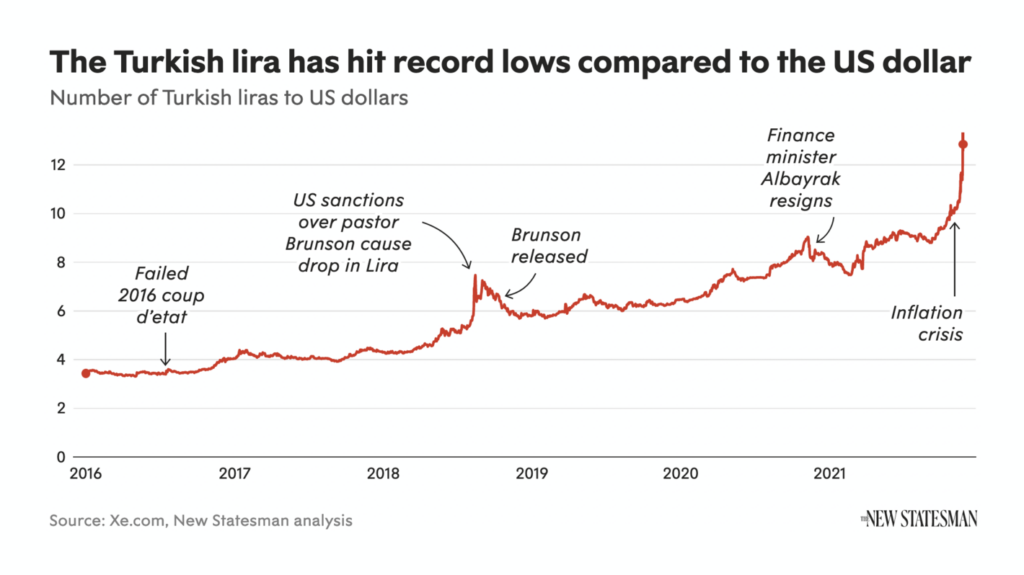
In economics, we still see most things rising: Inflation, house prices, and the number of Turkish lira you get for one U.S. dollar:

New York Times: Millennials Confront High Inflation for the First Time, November 28
Helen McKenzie: “A handy guide to house-buying in London: how many flat whites you’ll need to skip to save for a deposit across the city. I’m not crying, you’re crying,” November 26 (Tweet)
The New Statesman: What is happening to the Turkish lira?, November 24

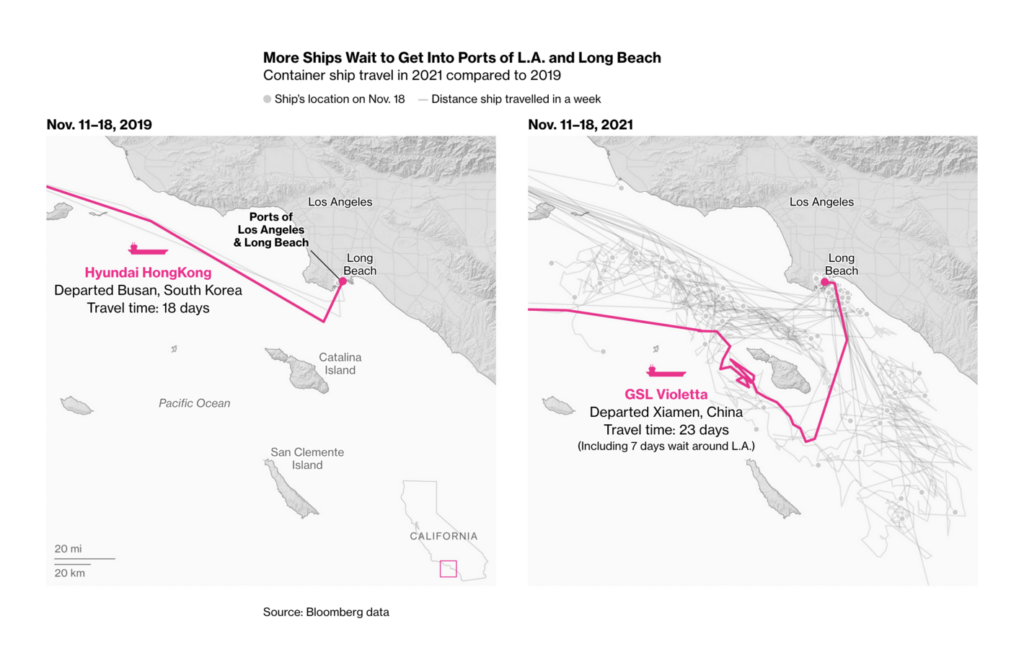
Impressive (and worrying) maps are created by Bloomberg and the Financial Times to report on the enduring global supply chain problems:

Bloomberg: Every Step of the Global Supply Chain Is Going Wrong — All at Once, November 23
Financial Times: China blocks access to shipping location data, November 23

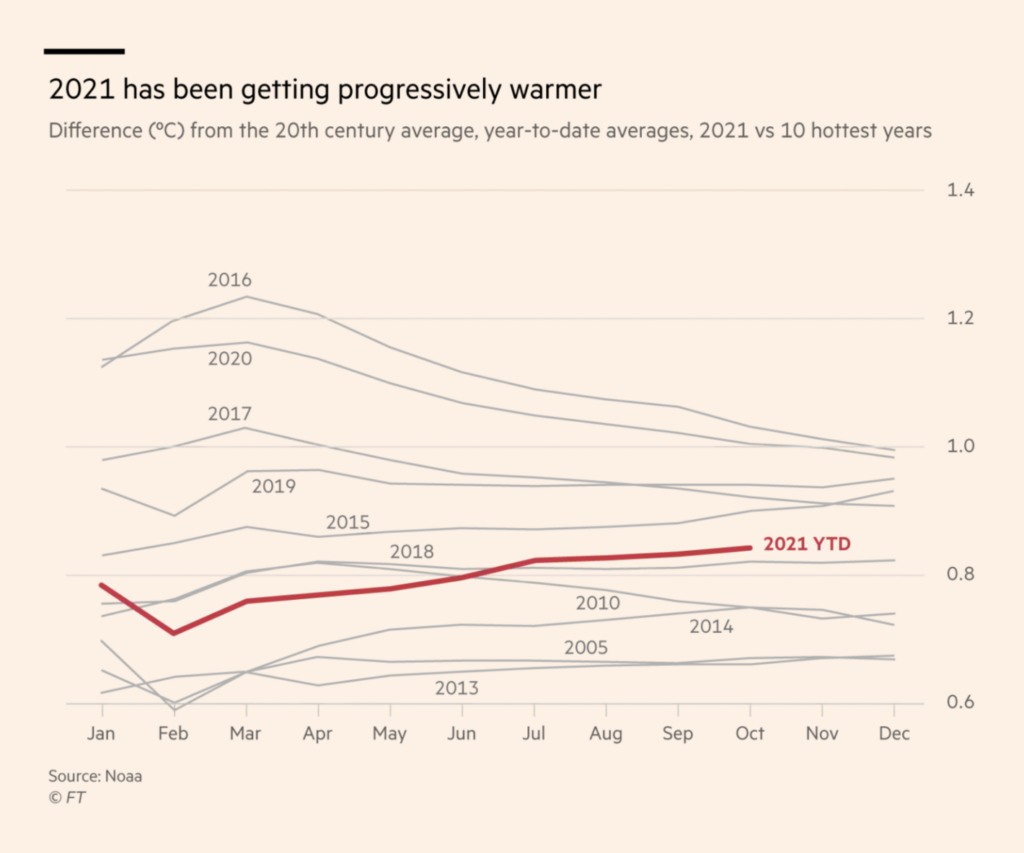
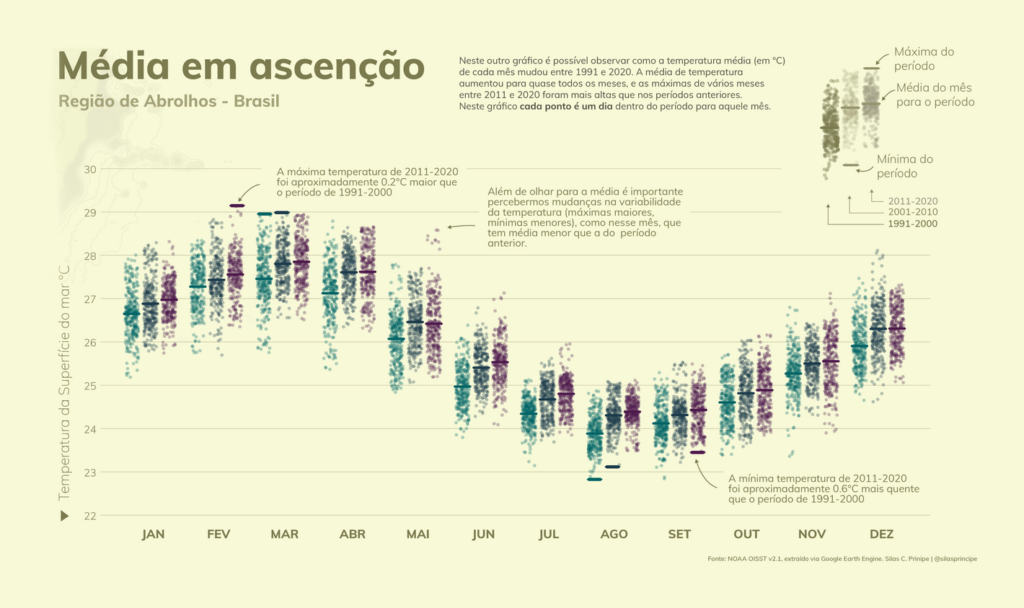
If this isn’t the first time you’re reading the Data Vis Dispatch, you know which topic is still missing: The climate crisis and its consequences. Here’s new and newly visualized data on rising temperatures:

Neil Kaye: “Here in the UK it is getting warmer, wetter and sunnier. This #dataviz shows a rolling 12 month of average temperature, total rainfall and total sunshine,” November 24 (Tweet)
Financial Times: Where have weather records been broken so far this year?, November 27
Silas Principe: “Nesse segundo é possível ver que a temperatura média da região aumentou quando comparamos três períodos entre 1991 e 2020. Máximas também estão ficando mais altas,” November 24 (Tweet)
The New Statesman: Climate change is now the most important issue, according to the British public, November 24

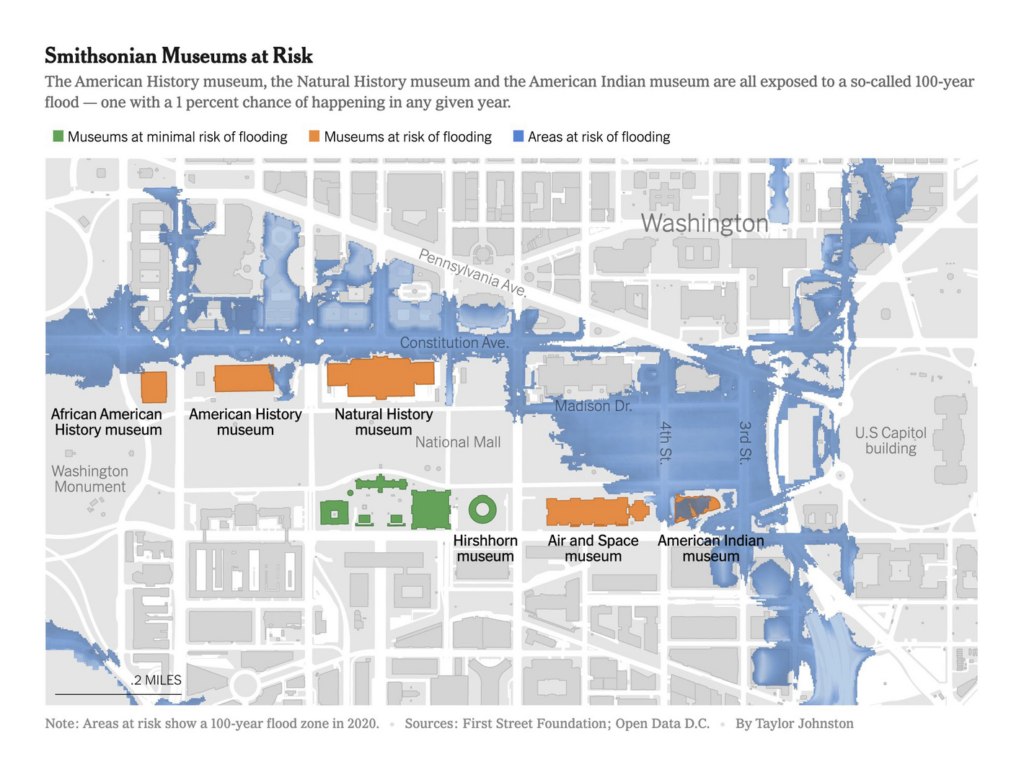
As a consequence of climate change, flooding becomes more likely and more severe:

Carl Churchill: Distribution of settlements, and potential flood risk from climate change, like here around the Salish Sea, November 27
Taylor Johnston: “My latest for @nytgraphics shows how vulnerable the National Museum of American History and other Smithsonian museums are to flooding,” November 26 (Tweet)

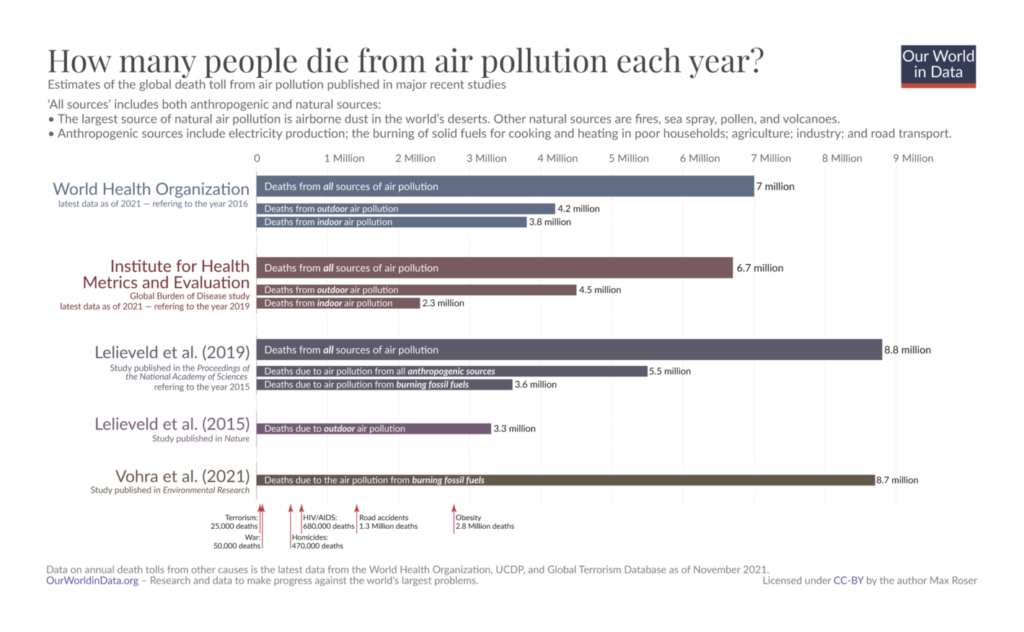
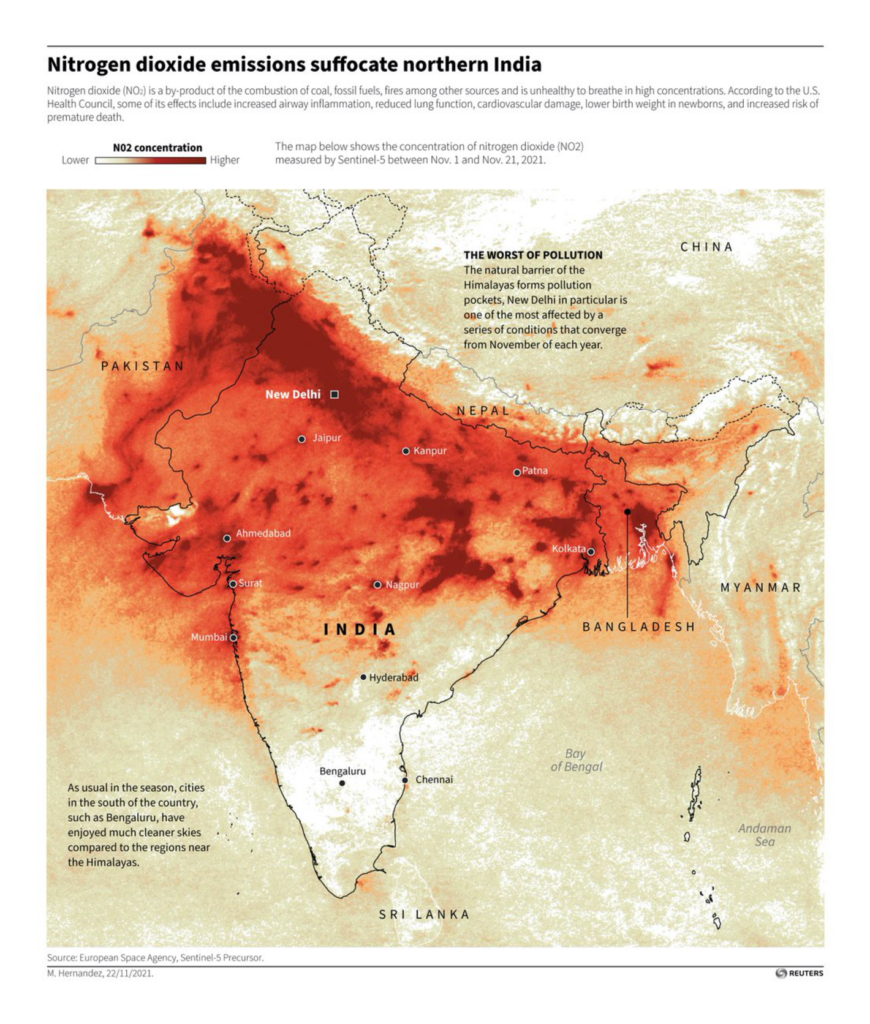
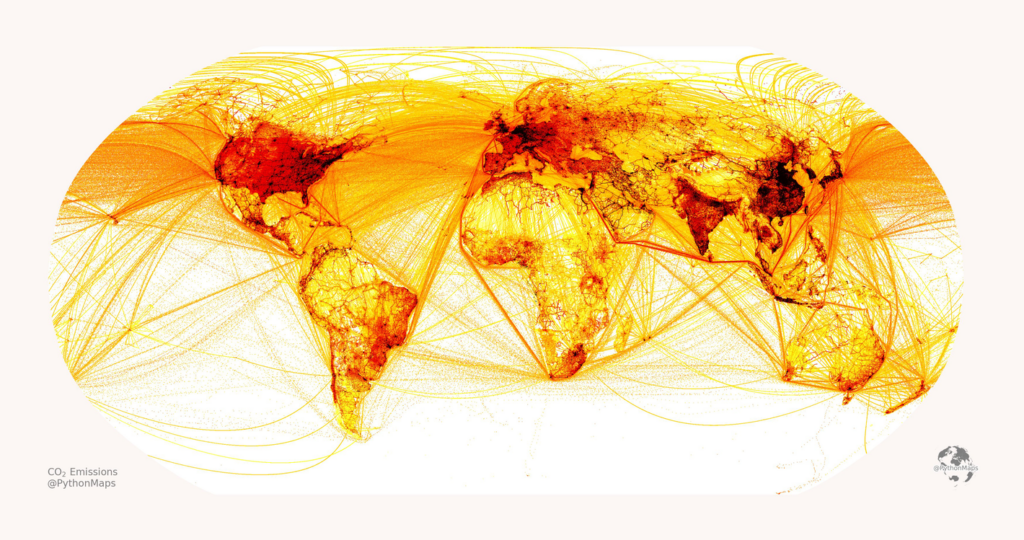
Surprisingly many organizations visualized data about air pollution in the past seven days. Our World in Data, Reuters, and ProPublica all showed different aspects of it:

Our World in Data: Data Review: How many people die from air pollution?, November 25
Reuters: “Air Pollution has hit dangerous levels across New Delhi and other parts of northern India this month. As wind speeds slow, the Himalayas tend to trap the colder, low-hanging winter air across northern India and Pakistan, with air pollution accumulating there, unable to escape,” November 23 (Tweet)
ProPublica: They Knew Industrial Pollution Was Ruining the Neighborhood’s Air. If Only Regulators Had Listened., November 29

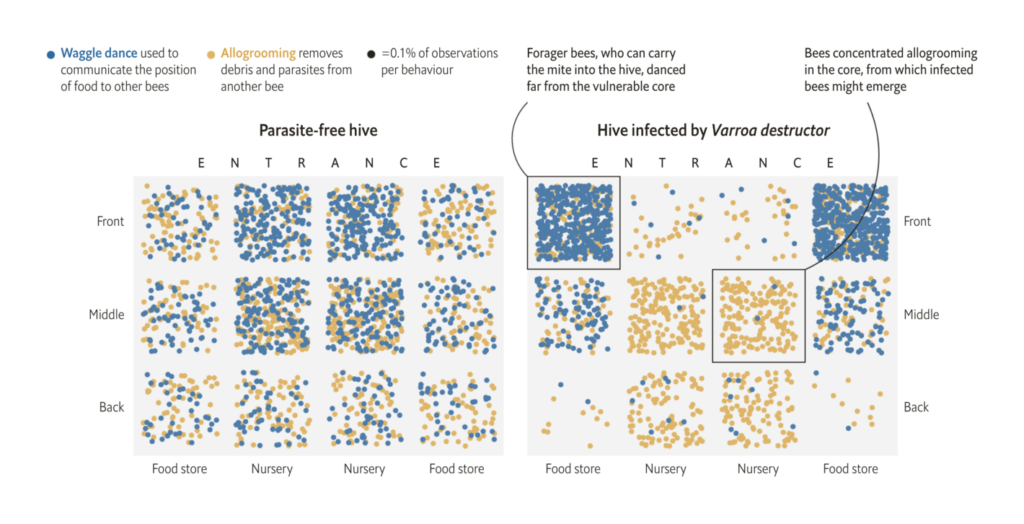
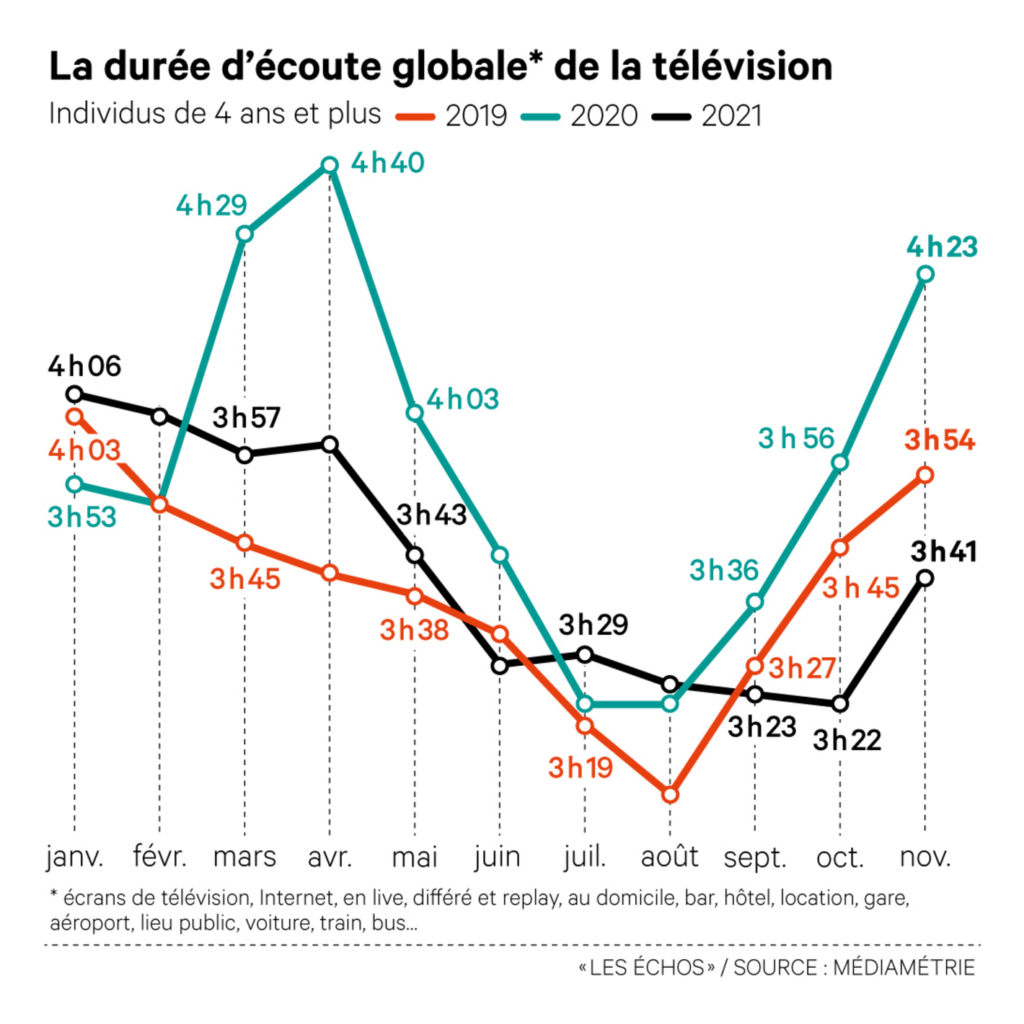
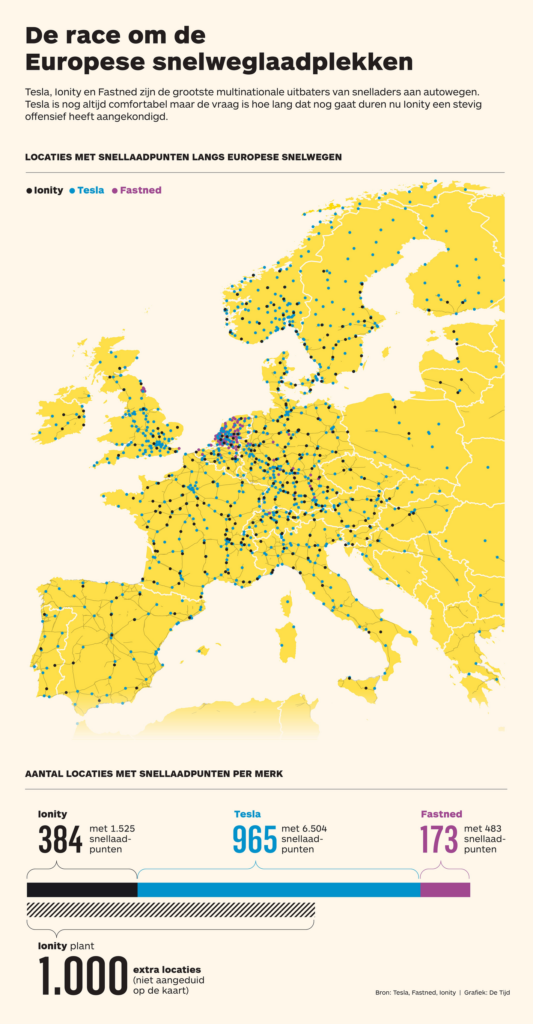
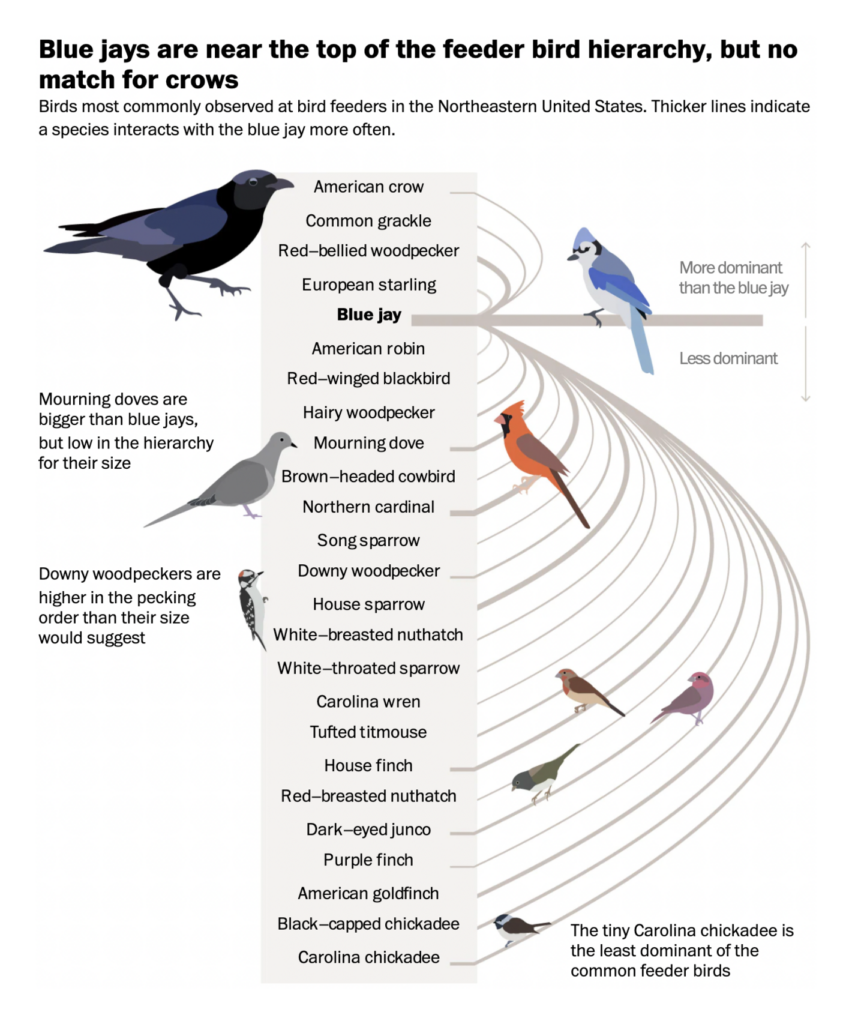
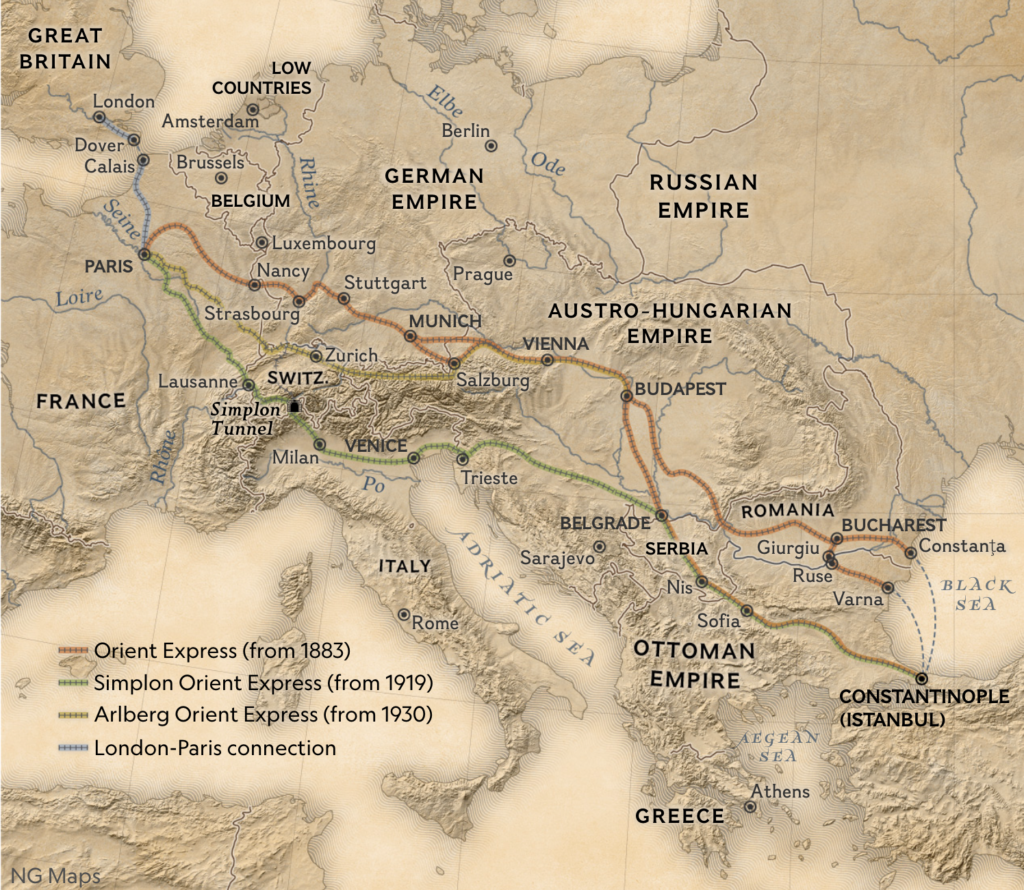
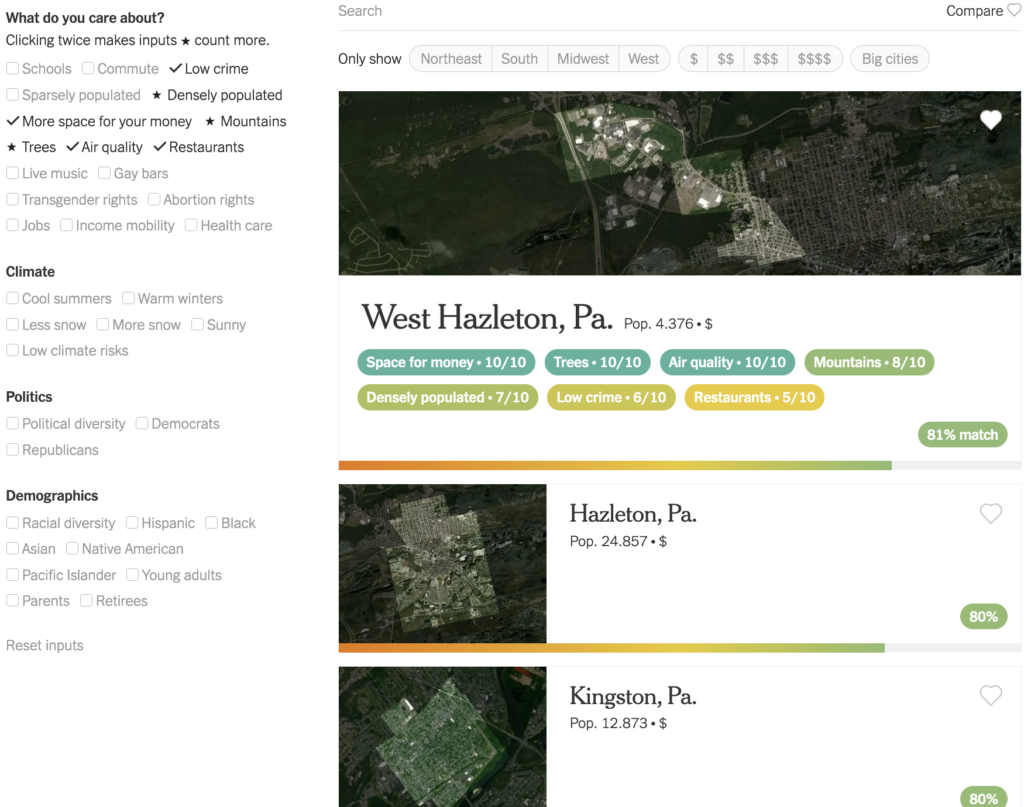
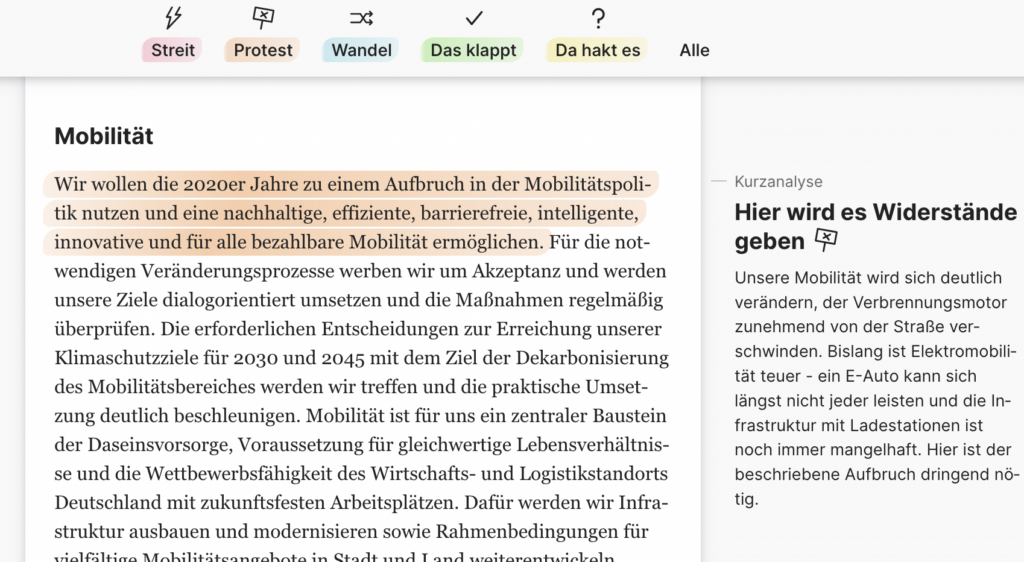
For our “well, these visualizations can’t be really sorted into any of the above categories, can they” category, you all created visualizations about hours spent in front of the TV during the pandemic, electric cars, feeder bird hierarchy (!), the Orient Express, and the new Reina Sofía collection:

Les Echos: Les Français passent plus de temps devant le petit écran, moins devant les chaînes de télévision, November 29 (Tweet)
De Tijd: De snelweg-laadpaal als nieuwe goudmijn, November 25
The Washington Post: Which birds are the biggest jerks at the feeder? A massive data analysis reveals the answer., November 28
National Geographic: More than just a ‘mystery’ train, the Orient Express whisked the elite across Europe in luxury and style, November 23
El País: El Museo Reina Sofía se reordena y cuenta otra Historia del Arte, November 26

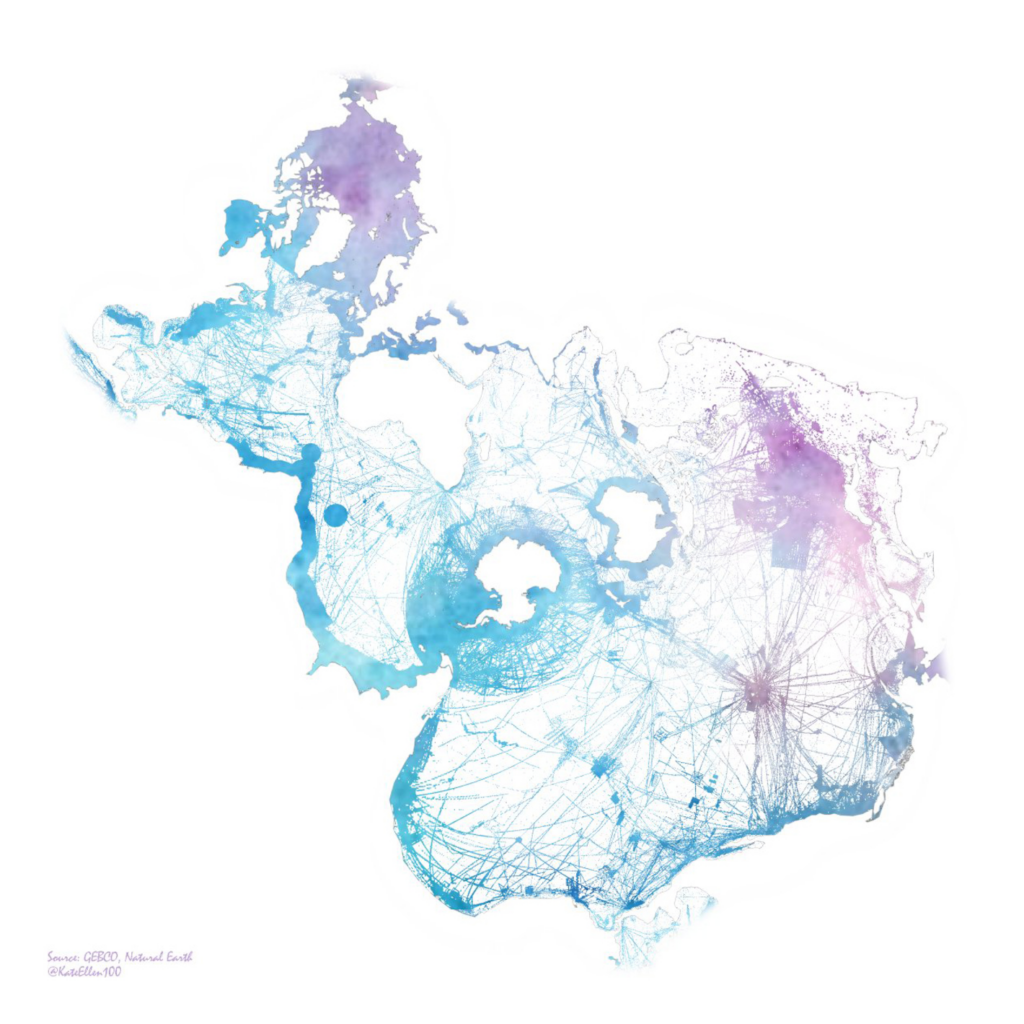
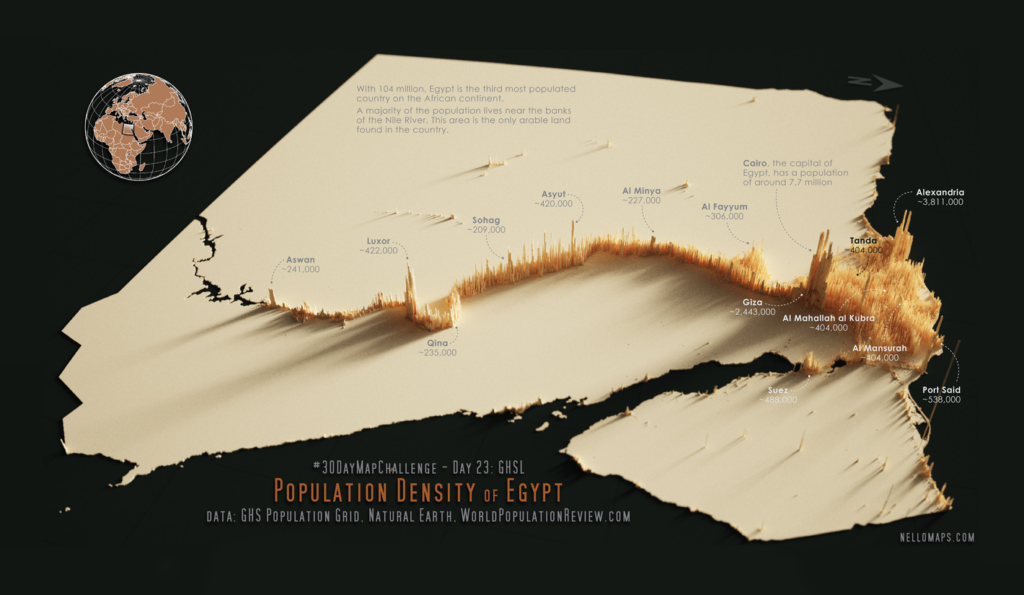
And one more time, we can show you some beautiful maps from the #30DayMapChallenge that ends today. Thanks for initiating and organizing it every year, Topi Tjukanov!

Kate: “Only 1/5 of the ocean floor has been mapped to a resolution of 100m or finer (shown in watercolour), the rest, a bit of a mystery! Great excuse to use Spilhaus. Day 29 – NULL #30DayMapChallenge,” November 29 (Tweet)
Nelson Schäfer: “Day 23 of #30DayMapChallenge Egypt’s unique distribution of population along the Nile River. Made with #Aerialod,” November 23 (Tweet)
PythonMaps: “Where do the world’s CO2 emissions come from? This map shows emissions during 2019. Darker areas indicate areas with higher emissions. Day 27 of the #30DayMapChallenge This map was made with #Python / #matplotlib,” November 27 (Tweet)

What else we found interesting

Washington Post: What’s on the Thanksgiving table in a hotter, drier world?, November 24
The New York Times: Where Should You Live?, November 23
RJ Andrews: “each line = 25,000 tons of goods Ministère des travaux publics. Direction de l’exploitation (service de la statistique). Carte figurative de la circulation des grosses marchandises sur les lignes de l’Etat pendant l’année 1879. See the whole map,” November 23 (Tweet)
Berliner Morgenpost: Koalitionsvertrag der Ampel – die wichtigsten Stellen markiert und kommentiert, November 24

What’s more:

  • The 2022 Sigma awards that “celebrates the best data journalism from around the world” now accept entries until January 7 (Tweet). Send them your best data journalism projects here.
  • Bloomberg is looking for graphics journalists in Tokyo, Singapore, Mumbai, and Hong Kong. Apply here.
  • Northeastern University (Boston campus) is looking for a tenure-track Assistant Professor in Information Design and Data Visualization. Apply here.

Help us make this dispatch better! We’d love to hear which newsletters, blogs, or social media accounts we need to follow to learn about interesting projects, especially from less-covered parts of the world (Asia, South America, Africa). Write us at hello@datawrapper.de or leave a comment below.

Comments