

New: Stay organized with a more powerful, faster visualization archive
June 25th, 2024
3 min
This article is brought to you by Datawrapper, a data visualization tool for creating charts, maps, and tables. Learn more.
When we launched the Datawrapper River almost six years ago, we described it as “a collection of charts that you can use in your own publication, for free.”
And that’s still what it is: People use the Datawrapper River to share charts, maps, and tables with other Datawrapper users. After adding a visualization to the River, anyone can use it and customize it in Datawrapper before publishing it on their own website in their own style. (If you haven’t used the River yet, our Academy article How to use the River is a good place to learn more.)
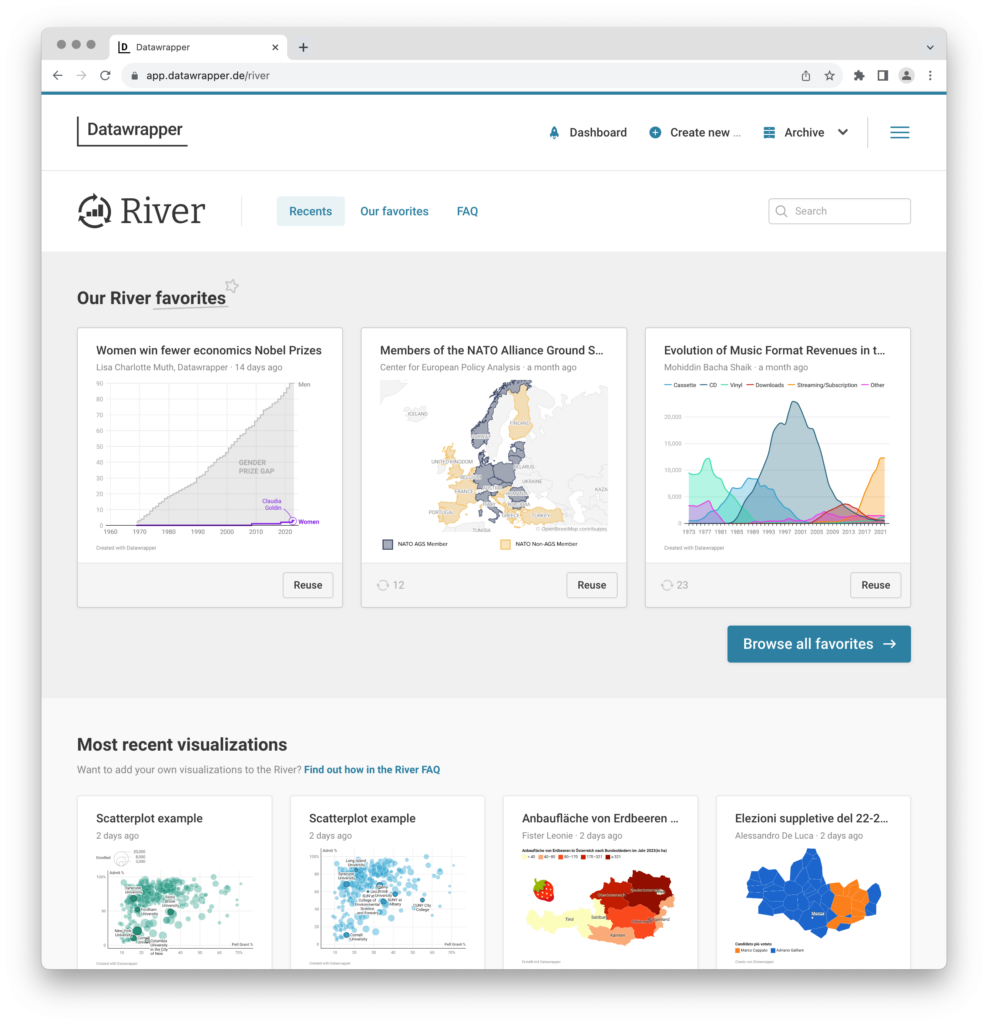
Yesterday, we added something new to it: The Datawrapper River now has a “Favorites” section, where you can browse through a handpicked list of our favorite visualizations from the River. If you’re a long-time Datawrapper user, you might remember that our original River had a Favorites section as well. We’re excited to bring it back and give it its own dedicated page that you can visit directly:
→ Visit “Our River favorites” here.
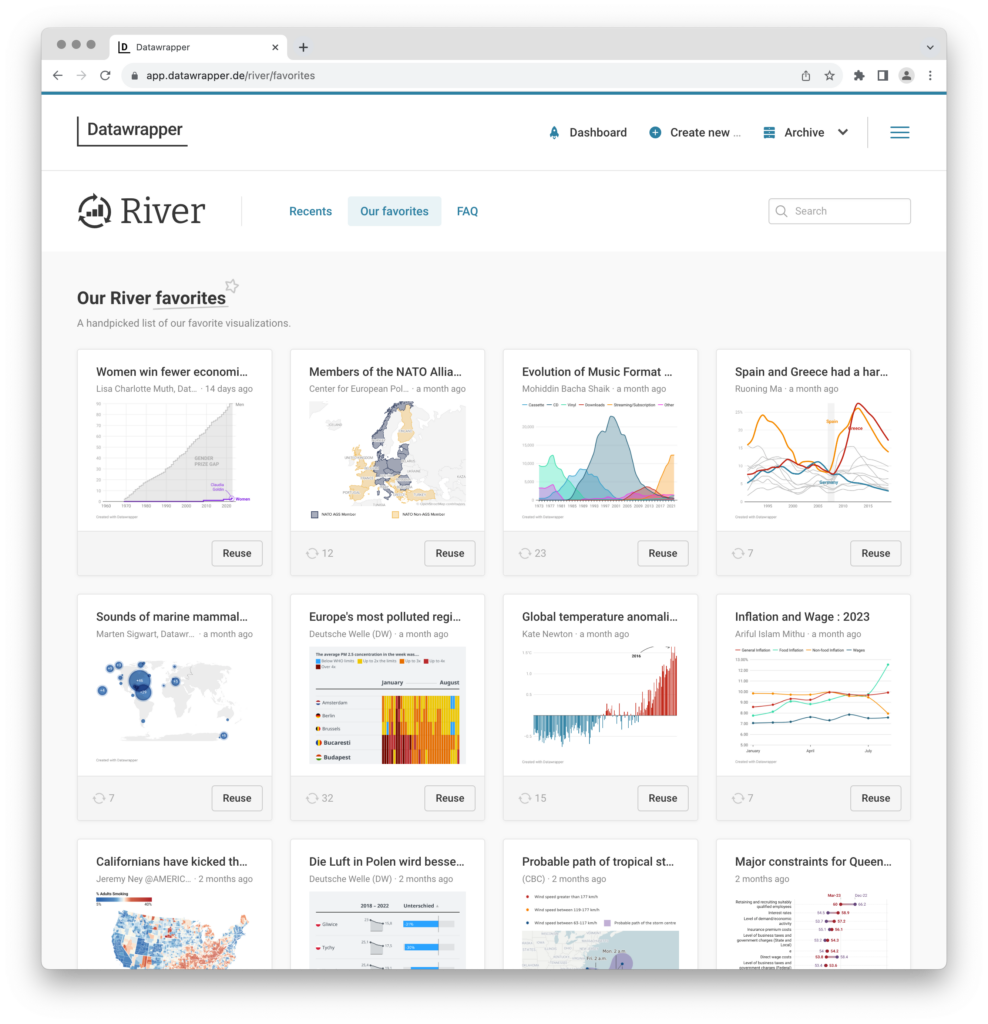
At least once a week, we go through all your recent additions to the River and select the charts, maps, and tables we like best — for their content, style, or how they use Datawrapper features.
You will always see the three most recently picked favorites at the top of the River home page.
And as with all River visualizations, you can easily reuse these favorites for your own publication, for inspiration, or just to find out how a nifty visualization was created.
Along with the new favorites page, we’ve also improved the River navigation to be simpler and fixed a few minor bugs, like the search field losing focus after loading results.
We can’t wait to see what you add to our refreshed River!
Do you have any feedback about the change? Let us know in the comments below or contact us at hello@datawrapper.de.
Comments