

How to get started with data visualization
November 15th, 2023
22 min
This article is brought to you by Datawrapper, a data visualization tool for creating charts, maps, and tables. Learn more.
I recently wrote a Weekly Chart that used a connected scatterplot to visualize population growth and migration rates over the years in Germany. If my first intention was to demonstrate how to create connected scatterplots with Datawrapper, I also received plenty of feedback regarding the somewhat controversial nature of this chart type. One reddit user commented, “At first I thought the graph was suggesting that Germany went back in time twice.” Another compared it to the Jeremy Bearimy timeline from “The Good Place” — probably not to praise my chart’s readability.
Connected scatterplots have critics galore. They look like time is going backwards; they don’t work well when both variables are volatile; they're hard to decipher without annotations; they just overload our brains with too much information and too many encoding channels; and a line chart is always better anyway. I think these criticisms are legitimate, and before writing my Weekly Chart I had read with interest this 2023 Nightingale article that convincingly describes these shortcomings and more.
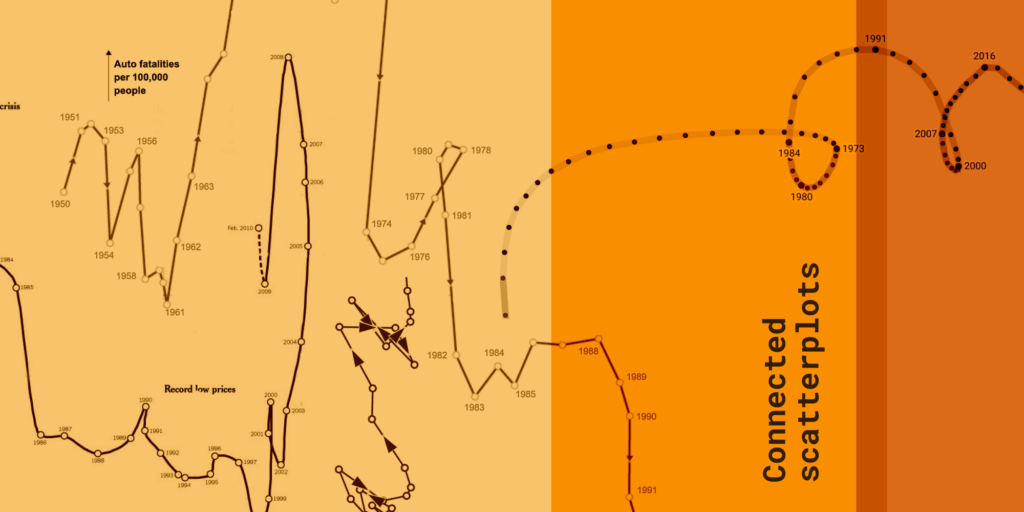
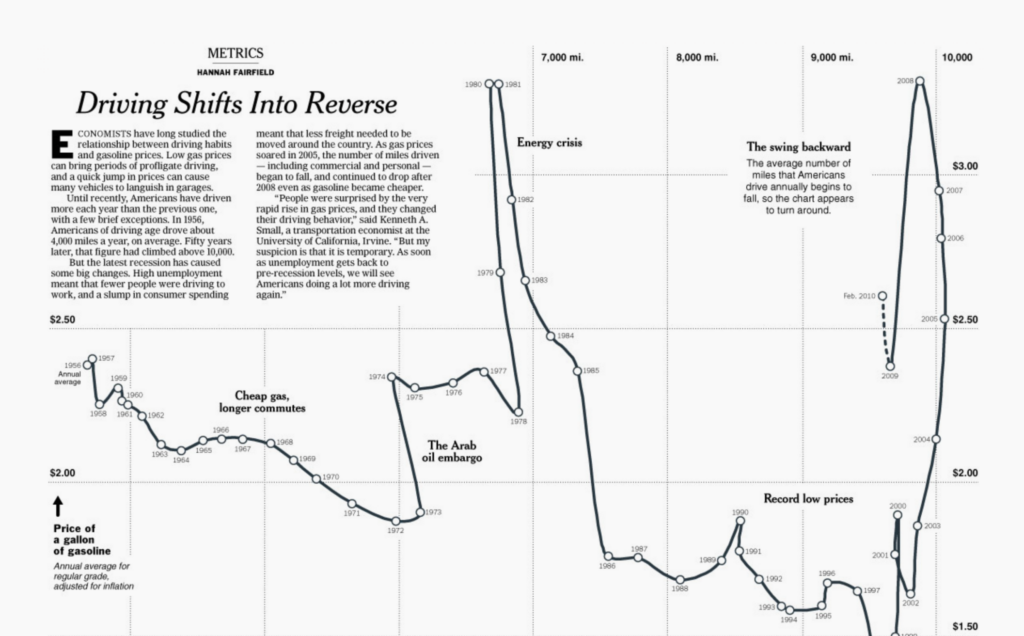
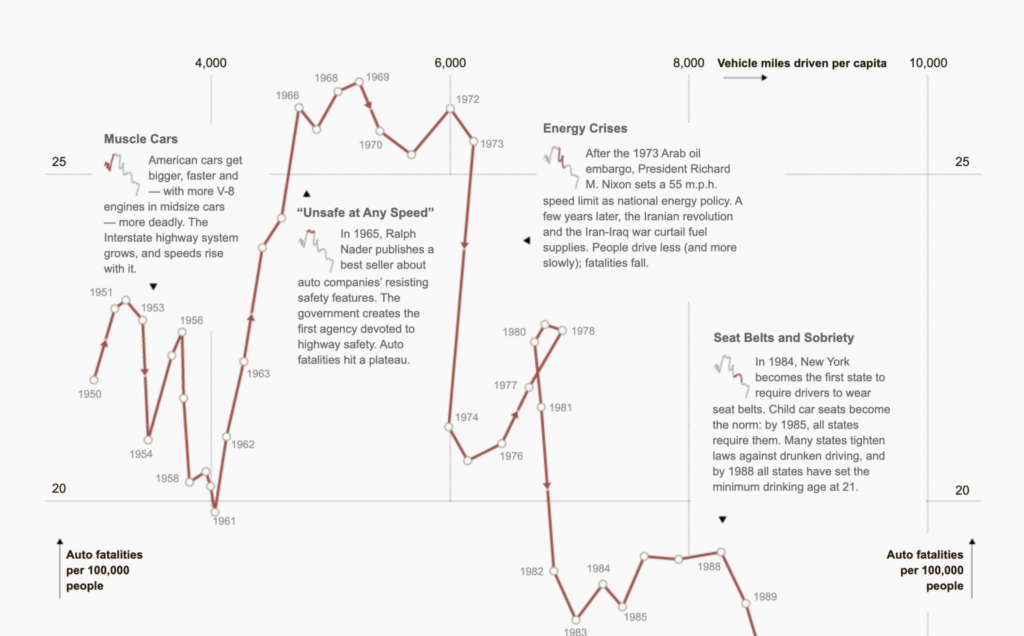
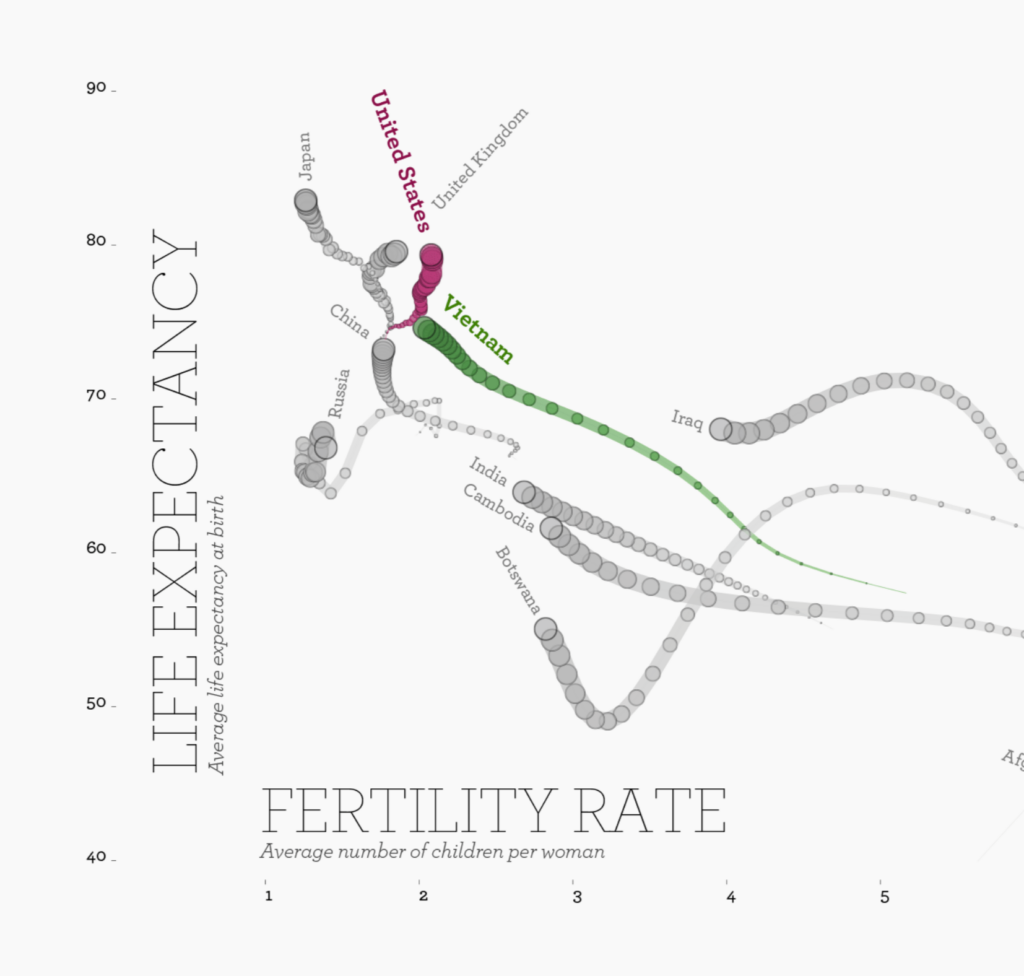
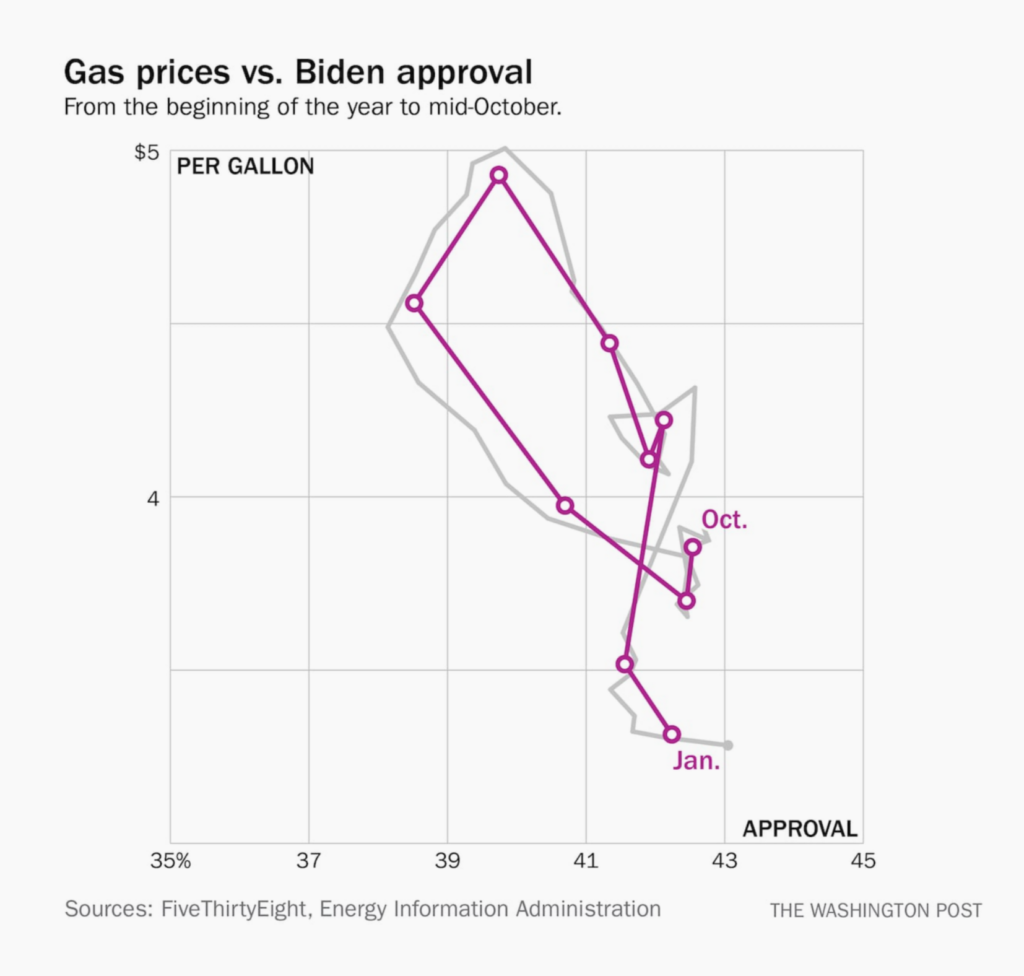
Nevertheless, I like connected scatterplots! I like to sit with them, learn their visual patterns, understand and feel the world that they represent. Hannah Fairfield's iconic charts on driving safety and gas prices for the New York Times belong to my personal pantheon of data visualizations.
So I tried to face all these criticisms of connected scatterplots and figure out what I still like about them.
One criticism is undoubtedly accurate: Connected scatterplots take some effort to wrap your head around. But I think that's common with more complex chart types, and not a reason to always avoid less familiar visualizations.
I personally often struggle to understand Sankey diagrams, and I couldn't read a sunburst or population pyramid on the first try. I learned to read these charts over time, and the best examples came with a slew of explanations, like this recent and compelling scrollytold Sankey on immigration from the New York Times. The web is full of great data visualizations that would not be easy to decipher without good design and annotations.
This is true for less common chart types like connected scatterplots — and even more so for exotic xenographics — but it's also true for simple charts. Simple charts are only great at conveying quick insights when they are well designed, and that often involves annotations.
All right, some complexity in our data visualizations might be worthwhile, but not just for its own sake! The biggest specific criticism of connected scatterplots is that they encode time in an unintuitive way.
We have a very strong, learned assumption that time in a line chart will flow linearly from left to right (or maybe right to left, depending on your language). And because they look so much alike on the surface, it’s hard not to conflate a connected scatterplot with a line chart.
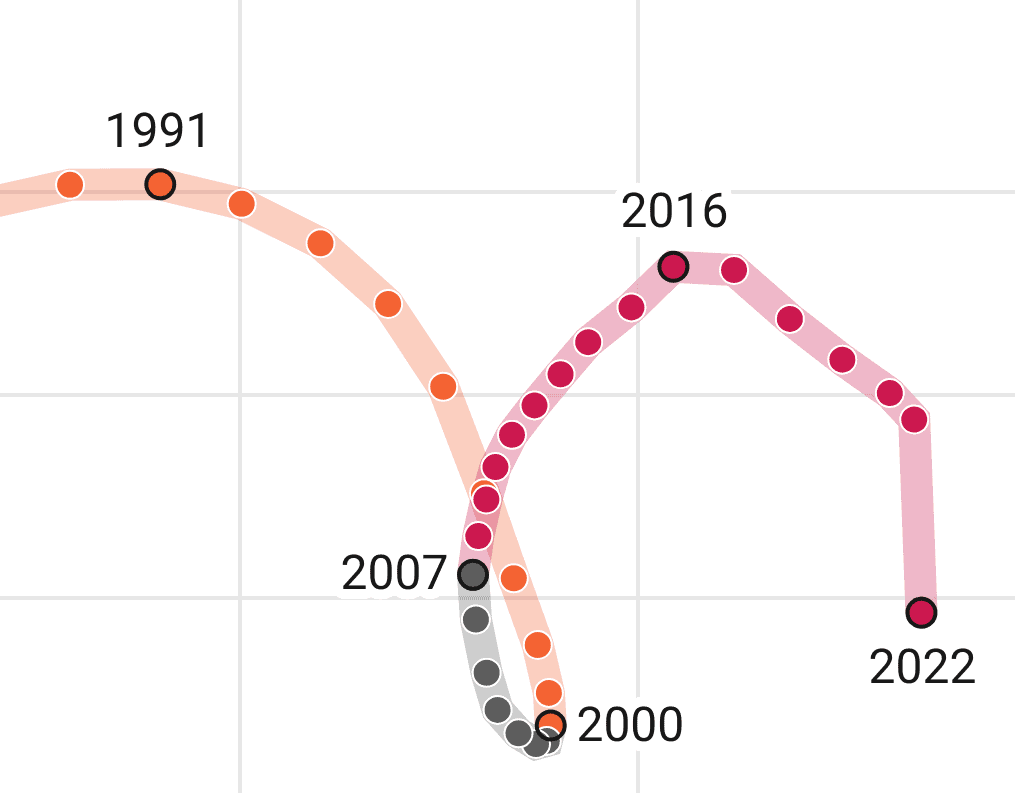
To thwart the intuition that time is on the x-axis, I gave the connecting line in my scatterplot a lower opacity than the dots, to highlight that we are indeed looking at a scatterplot and not a line chart. I also used colors to represent the different time periods described in my essay, to anchor the chart in readers' historical understanding.
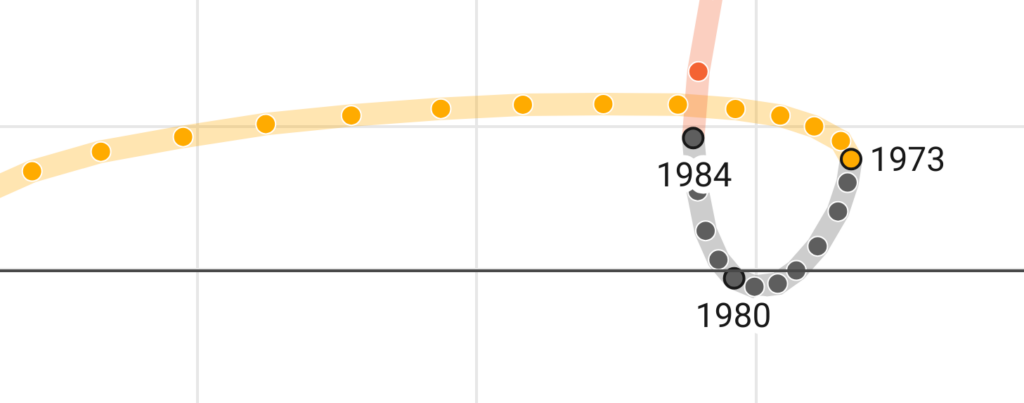
Because the dots aren't all equally far apart, time changes speed along the line, which goes against the convention that time is linear. But other visual insights emerge from this uncommon representation. Chart readers tend to interpret points that are close to each other as a natural group — in the case of a connected scatterplot, clusters define a period in which both variables are stagnant. In the two periods of population decline, for instance, (colored in grey) the dots are rather close to each other, which means that there was just not much happening population-wise during that time, while between the 1950s and 1970s, points are spread out because at least one variable was changing very fast.
Applying line chart intuitions can make time in a connected scatterplot seem to “slow down,” or even go backwards. But it's worth the effort to read scatterplots on their own terms!
In a line chart, steep lines mean rapid change. But connected scatterplots are still scatterplots, and the diagonal alignment of their dots has to do with the correlation between their two variables.
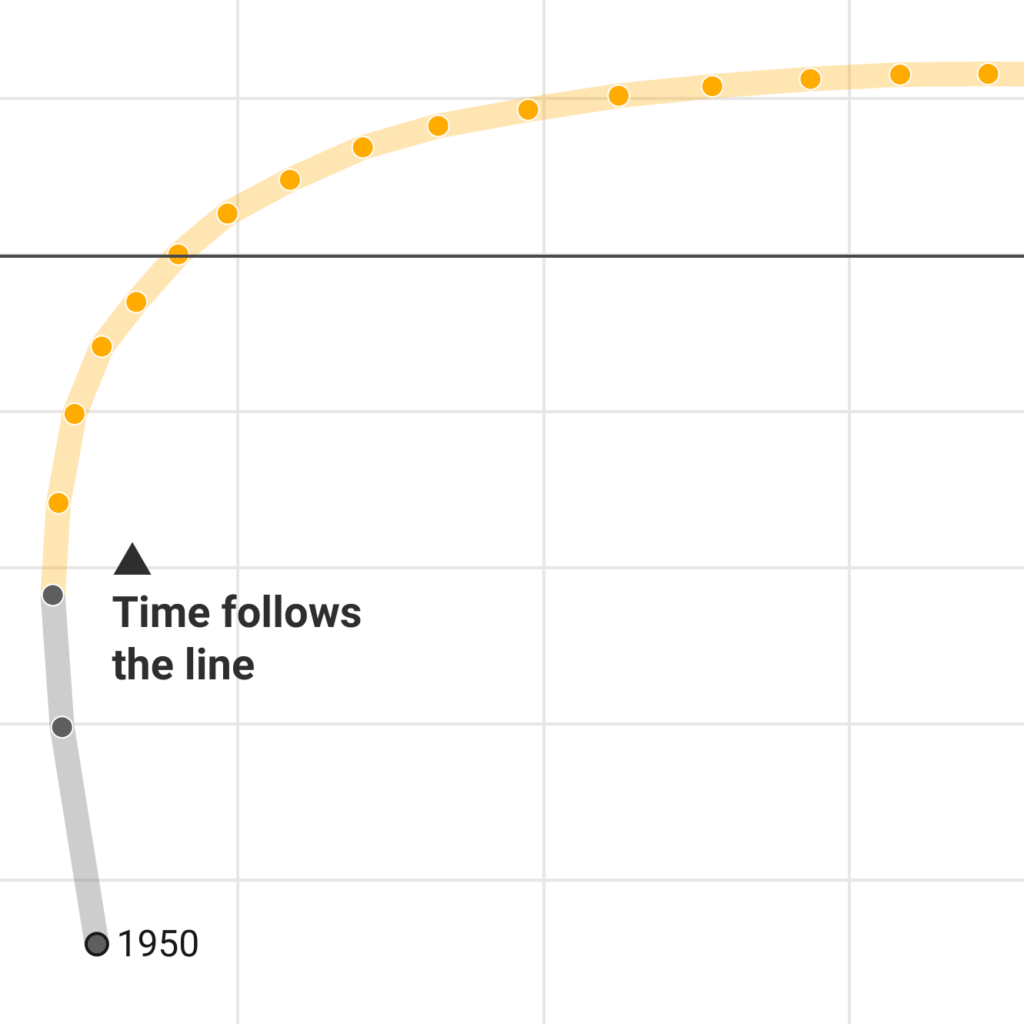
Between 1950 and 1955, the steep upwards line indicates a quick increase in migration while population was stagnating; in the horizontal plateau from 1960 to 1970, population increased a lot while migration stagnated. Long horizontal or vertical line segments represent a large change in one variable, but not both. The less diagonal the line, the more uncoupled the variables are.
This is where the “brain overload” of connected scatterplots might kick in. You need to pay attention to many visual variables: the dots' position on both axes, the distances between them, and also the orientation of the line. To compensate for this discomfort, connected scatterplots reward the reader with a dramatic surprise: loops!
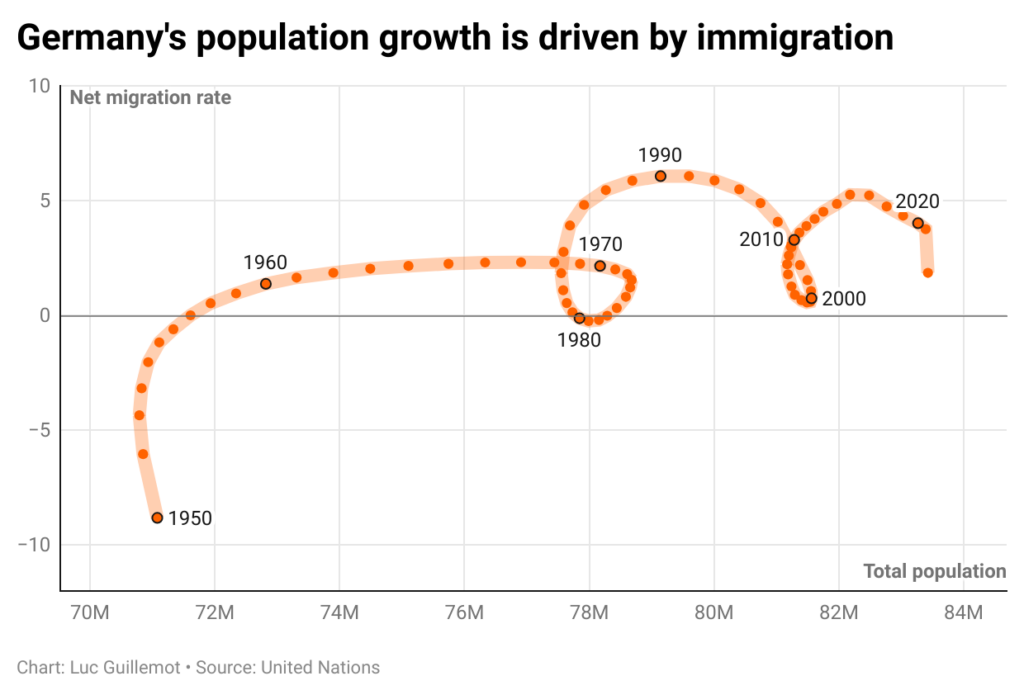
Loops are such an unusual shape in data visualizations that they necessarily suggest an interesting dynamic between variables. The two loops in my scatterplot can be interpreted as periods of crisis that influence both our variables and scramble the correlation between them. It’s not time that goes backwards, but the "progress" of Germany's increasing population and migration.
Another common criticism is that all this effort to understand the dynamics at play makes it hard to gather quick take-aways from a connected scatterplot. I would say this is rather their selling point — they're intriguing and invite closer attention. They belong to the category of charts that need a sequential reading.
I read a connected scatterplot like I read a comic panel: First identify zones of visual interest (the loops, the plateaus, the angles) as moments where something happens, then try to unfold the sequence of events that explains the shape of the curve.

An indexed line chart will always be relevant and efficient for representing two related variables over time. But I'm convinced there is also a place for connected scatterplots because they make the relation between these variables visually stand out in a way that is disruptive to the well-known language of line charts.
This is true for chart readers, but also for chart creators! If the three variables — x, y, and time — do have a meaningful relationship, an interesting shape will emerge. Connected scatterplots have a heuristic power that really makes me love data visualization as a craft for sense making.
Connected scatterplots bring something special to the diversity of chart types, something unusual and narratively rich, a regime of visual saliency where a loop has a drama that a simple curve doesn't, and where an unfolding story can trump a quick takeaway.
Further reading


Comments