Watch the recordings of Unwrapped, our conference
August 12th, 2024
5 min
Datawrapper lets you show your data as beautiful charts, maps or tables with a few clicks. Find out more about all the available visualization types.
Our mission is to help everyone communicate with data - from newsrooms to global enterprises, non-profits or public service.
We want to enable everyone to create beautiful charts, maps, and tables. New to data visualization? Or do you have specific questions about us? You'll find all the answers here.
Data vis best practices, news, and examples
250+ articles that explain how to use Datawrapper
Answers to common questions
An exchange place for Datawrapper visualizations
Attend and watch how to use Datawrapper best
Learn about available positions on our team
Our latest small and big improvements
Build your integration with Datawrapper's API
Get in touch with us – we're happy to help

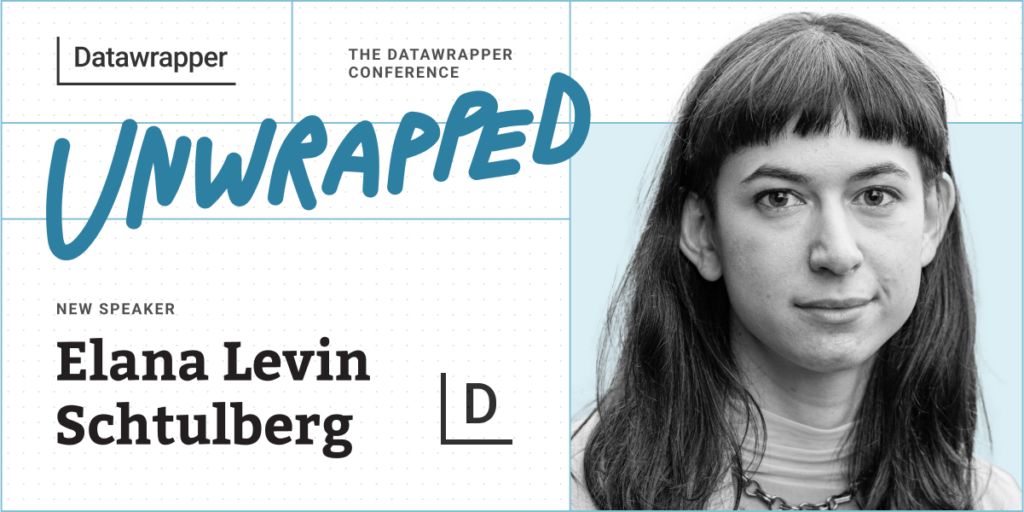
We’re excited to announce that our very own Elana Levin Schtulberg will speak at the Unwrapped conference about “Visualization development at Datawrapper: a peek behind the curtain.”
Elana leads visualization development at Datawrapper. She’s been with the team for nearly 6 years, having spent the majority of her time with Datawrapper as support team lead. A mixed academic background in physics and design is what led her to data visualization and laid the foundations for her data vis and development practice – but most of what she learned was on the job, from her super talented, knowledgeable, and skilled coworkers, and from Datawrapper’s users, through her relentless dedication to understanding what they need, and helping them get it from the tool.
Time to ask her some questions:
Have you ever wondered how we decide what features to add? How we figure out exactly what form they’re going to take? And what actually goes into transforming them from idea to reality (while making sure not to break anything in the process)? In my talk, I’ll share some insight into all of this, including real-life examples from our most recent big launch, small multiple line charts.
Lots of things! I love helping others succeed, whether that be our users, or my coworkers. I think it’s really exciting to be in the position of a toolmaker – empowering people to create things they would otherwise not be able to (or not as easily), while also getting to be surprised, amazed, and inspired by what they make of it. It’s a big responsibility, but also really rewarding. And of course not to mention all the lovely feedback we get! 💖
The fact that everyone has the chance to contribute meaningfully to the product, including in areas outside of their immediate responsibilities. I think we all feel a shared responsibility and love for the product, and appreciate the ability to put our ideas forward and discuss them together.
While these aren’t core data vis features, I’d like to give 2 feature shoutouts that might not otherwise get a mention:
I know it’s quite basic, but: actually designing my own data vis from scratch. While helping and teaching others has allowed me to hone the skill of improving visualizations or ideating from a given starting point, the process of coming up with my own ideas and realizing them in an interesting way is a muscle that I’ve not stretched so much, and would like to (although I’ll admit, it feels a bit intimidating!)
Reach out if you’re stuck, if something seems broken, or if you have feedback to share! Our support team is lovely and will help you. We value your ideas and opinions. And we'll will listen to them.
We're looking forward to Elana's talk at Unwrapped! Until then, you can learn more about her on LinkedIn. To sign up for Unwrapped and hear Elana and other great speakers, visit our conference website.
Comments