

New: Stay organized with a more powerful, faster visualization archive
June 25th, 2024
3 min
This article is brought to you by Datawrapper, a data visualization tool for creating charts, maps, and tables. Learn more.
A quick look at the features we launched over the past 12 months
2020 was a crazy year in many ways. Fortunately, we at Datawrapper were not affected negatively (besides working from home since March). So we are proud to have managed to release quite a few new features. I took some time to summarize how Datawrapper has evolved in 2020.
Let’s start with the new visualization features we launched in 2020:

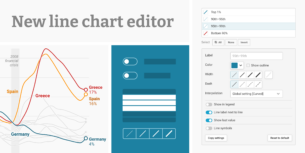
We released completely renewed annotations featuring callout lines and a more intuitive drag & drop interface for editing annotations. We also expanded them from scatter, line, and area plots to column charts and maps.

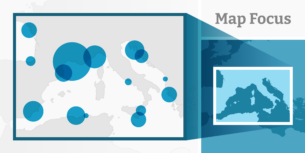
Speaking of maps, 2020 brought a range of map improvements and new map features to Datawrapper:

Our locator maps have also seen some updates over the past year:

It’s not so long ago that we launched our completely new tables in 2019, but last year it was time for two noteworthy improvements:

We haven’t properly announced this feature yet, but you may have noticed that the horizontal and vertical axes (aka grids) in our scatter plots, line, and area charts have changed. More on this soon.
We also launched a lot of features for our chart editor that helps you make better charts, maps, and tables:
As you can see, a lot was going on at Datawrapper in 2020 — and we’re looking forward to this year. While our roadmap is under continuous development, there are three exciting projects we already started working on that we can share with you[1]:
If you want to get more updates on new Datawrapper features, be sure to check out our Changelog, too.
That’s it for 2020! If you found this summary interesting, you may also find some value in learning how our users have used Datawrapper in 2020.
Comments